X

NV5 Geospatial Blog

Each month, NV5 Geospatial posts new blog content across a variety of categories. Browse our latest posts below to learn about important geospatial information or use the search bar to find a specific topic or author. Stay informed of the latest blog posts, events, and technologies by joining our email list!


Not All Supernovae Are Created Equal: Rethinking the Universe’s Measuring Tools

Not All Supernovae Are Created Equal: Rethinking the Universe’s Measuring Tools

6/3/2025

Rethinking the Reliability of Type 1a Supernovae   How do astronomers measure the universe? It all starts with distance. From gauging the size of a galaxy to calculating how fast the universe is expanding, measuring cosmic distances is essential to understanding everything in the sky. For nearby stars, astronomers use... Read More >

Using LLMs To Research Remote Sensing Software: Helpful, but Incomplete

Using LLMs To Research Remote Sensing Software: Helpful, but Incomplete

5/26/2025

Whether you’re new to remote sensing or a seasoned expert, there is no doubt that large language models (LLMs) like OpenAI’s ChatGPT or Google’s Gemini can be incredibly useful in many aspects of research. From exploring the electromagnetic spectrum to creating object detection models using the latest deep learning... Read More >

From Image to Insight: How GEOINT Automation Is Changing the Speed of Decision-Making

From Image to Insight: How GEOINT Automation Is Changing the Speed of Decision-Making

4/28/2025

When every second counts, the ability to process geospatial data rapidly and accurately isn’t just helpful, it’s critical. Geospatial Intelligence (GEOINT) has always played a pivotal role in defense, security, and disaster response. But in high-tempo operations, traditional workflows are no longer fast enough. Analysts are... Read More >

Thermal Infrared Echoes: Illuminating the Last Gasp of a Dying Star

Thermal Infrared Echoes: Illuminating the Last Gasp of a Dying Star

4/24/2025

This blog was written by Eli Dwek, Emeritus, NASA Goddard Space Flight Center, Greenbelt, MD and Research Fellow, Center for Astrophysics, Harvard & Smithsonian, Cambridge, MA. It is the fifth blog in a series showcasing our IDL® Fellows program which supports passionate retired IDL users who may need support to continue their work... Read More >

A New Era of Hyperspectral Imaging with ENVI® and Wyvern’s Open Data Program

A New Era of Hyperspectral Imaging with ENVI® and Wyvern’s Open Data Program

2/25/2025

This blog was written in collaboration with Adam O’Connor from Wyvern.   As hyperspectral imaging (HSI) continues to grow in importance, access to high-quality satellite data is key to unlocking new insights in environmental monitoring, agriculture, forestry, mining, security, energy infrastructure management, and more.... Read More >

1345678910Last
23552 Rate this article:
4.4

Shining a Little Light on Vegetation Indices

Anonym

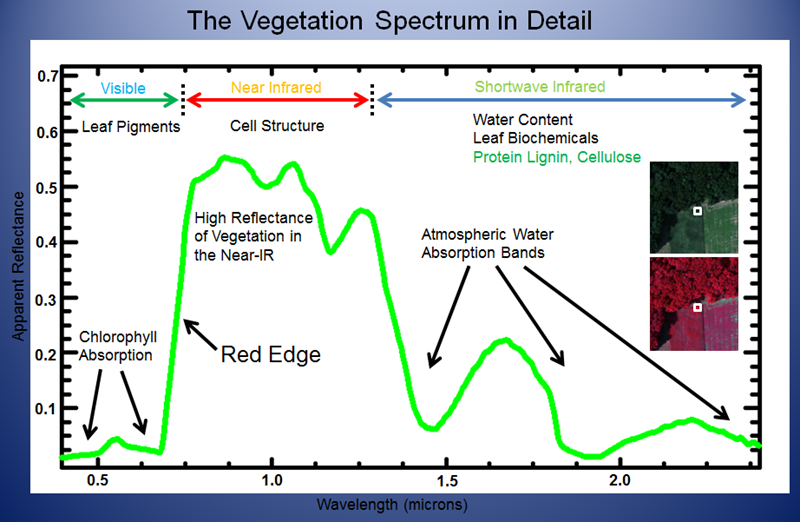
Vegetation interacts with solar radiation in a different way than other natural materials. The vegetation spectrum typically absorbs in the red and blue wavelengths, reflects in the green wavelength, strongly reflects in the near infrared wavelength (NIR), and displays strong absorption properties in wavelengths where atmospheric moisture is present. The unique properties of vegetation have allowed spectral scientists to develop a number of vegetation indices (VIs) to aid in monitoring the health of vegetation. VIs are combinations of surface reflectance at two or more wavelengths designed to extract useful information about vegetation. More than 150 unique VIs have been developed and published in scientific literature over the past several decades. Many VIs are currently unknown or under-used in commercial, government and scientific communities.

Vegetation Spectrum, ENVI

Perhaps the most common, and most often used VI, is the Normalized Difference Vegetation Index (NDVI). The NDVI is a simple, but effective VI for quantifying vegetation. The NDVI normalizes green leaf scattering in the near-infrared wavelength and chlorophyll absorption in the red wavelength. The NDVI is defined by the following equation:

NDVI = (NIR – RED) / (NIR + RED)

NDVI values range from -1 to 1, with the common range for green vegetation falling between values of 0.2 and 0.8.  While the NDVI is likely the most common VI, there are a number of other VIs that are worth exploring when using satellite imagery to monitor vegetation. When choosing the appropriate VI to use, it is important to consider what you are interested in getting out of your data. For instance, if you are interested in performing a fire fuel analysis, there are a number of VIs that have been specifically designed to provide an estimate of the amount of carbon in dry states of lignin and cellulose.  Dry carbon molecules are present in large amounts in woody materials and senescent, dead, or dormant vegetation.  These materials are highly flammable when dry. Dry or senescent carbon VIs use reflectance measurements in the shortwave infrared range to take advantage of known absorption features of cellulose and lignin. One such example of a VI that takes advantage of these features is the Cellulose Absorption Index (CAI). The CAI is useful for identifying exposed surfaces containing dry plant material. CAI is defined by the following equation:

CAI = 0.5(2000nm +2200nm) - 2100nm

The value range of this index ranges from -3 to more than 4, with the common range for green vegetation falling between values of -2 to 4. If you are interested in learning more about VIs and how you can use them to get the information you need from your data, you just might be in luck. I have been working with a colleague to put together a whitepaper that outlines 27 of the most commonly-used VIs and will share it soon!

Please login or register to post comments.