Squaring the Circle: Coming to Terms With the Earth Being Round
Viewing WGS84 Data On A Flat Screen Provides A Lot To Think About
Anonym
Sometimes when thinking about issues related to mapping and cartography, it helps to refer to a globe. I love globes. I've always liked scale models, and what could be more impressive than a miniature replica of our entire planet? We don't see the old-fashion, real-world kind of globes around as much as we used to. These days, everyone can pull up a virtual globe whenever they wish on their desktop, tablet or phone. They are useful because they allow us to better visualize geographic spaces.
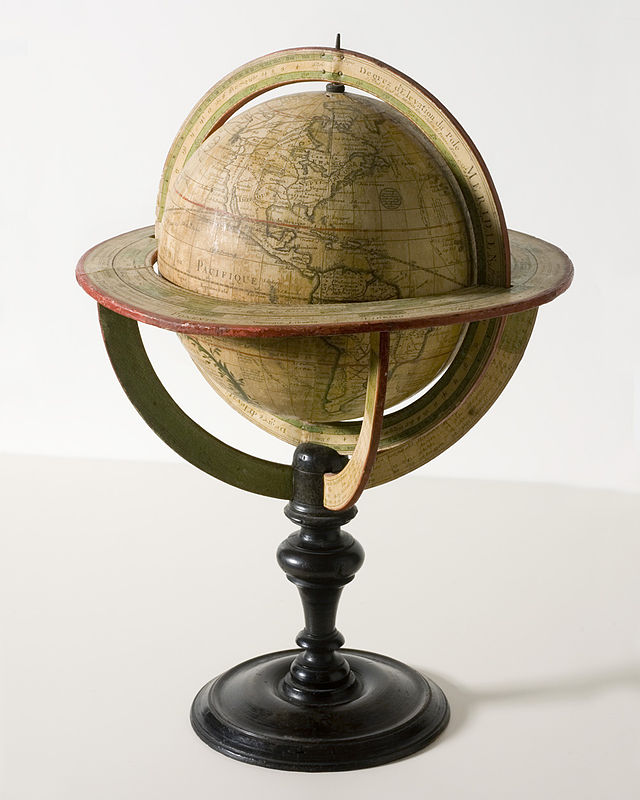
Image from the Minnesota Historical Society, CC BY-SA 3.0
Hellenistic astronomy established the physical fact that the Earth is spherical in shape in the 3rd century BC. History credits the ancient Greek philosopher Crates with being the first to devise a globe to represent the Earth not long after. Two millennia may have passed since then, but globes have lost none of their utility, simply because a globe is the only way to represent the earth without distorting either the shape or the size of large features.
A geographic coordinate system allows us to index the world – that is to be able to specify any location on the planet with a set of coordinate values. Any point on the surface of a globe can be labelled with two coordinate values, latitude and longitude being the most common example. The key to remember is that we are discussing a point on the two-dimensional surface of a three-dimensional object such as a sphere or an ellipsoid. So latitude and longitude are angular coordinates, values that carry with them angular units, such as degrees. Latitude specifies an angle that determines how far north or south of the equator a given location is, and longitude indicates the angle that the location intersects on a circle that traverses the world in the east-west plane. We often helpfully inscribe our globes with a crisscrossed grid of constant latitude and longitude lines (parallels and meridians) called the graticule.
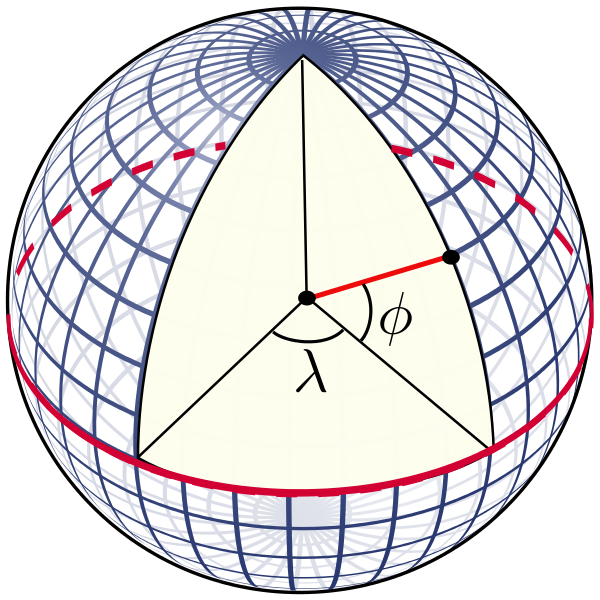
Image: Public Domain
Globes really do make things so easy to visualize the big picture. But of course, we don't typically perceive the world at such scale, but rather locally. Needless to say, our common everyday experience provides a framework that makes it appealing to model the world – or at least our little region of it – as being flat. The map is a human invention that well precedes the arrival of the globe. There is a star chart painted on the walls of the Lascaux caves that has been dated to 16,500 BC. More down to earth, geographic maps of territory existed in even the most ancient times. Traditionally, maps whether they be rendered on cave walls, parchment, paper or computer screens, are flat. For a whole lot of reasons, it's easier that way. The word "map" itself comes from the Latin term Mappa mundi, mappa having the meaning of napkin or cloth, and mundi the world. The word "map" thereby became a shorthand term referring to any two-dimensional representation of the world.
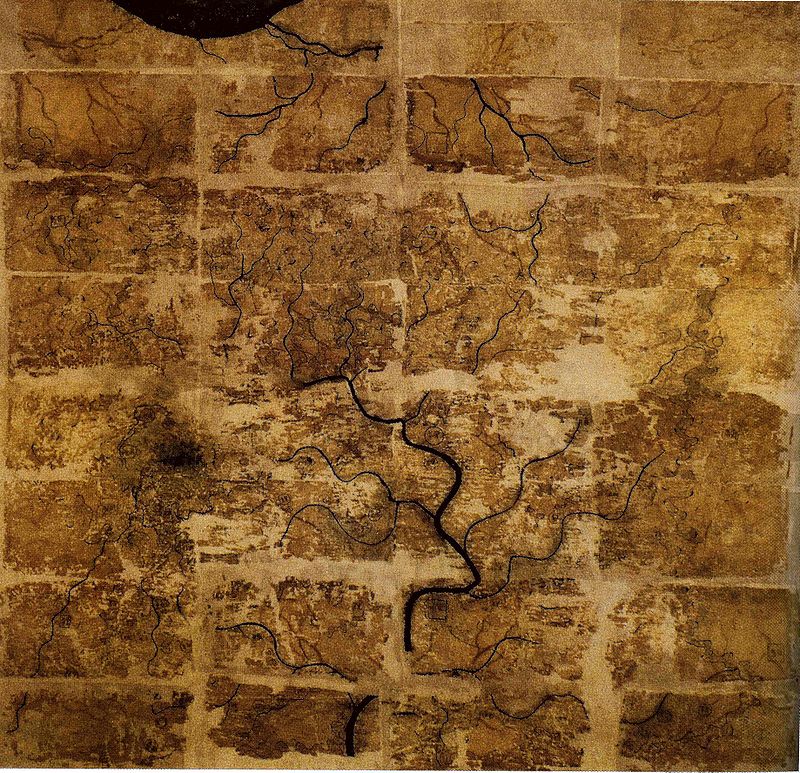
Image: Public Domain
Maps are incredibly powerful tools, but among all the many advantages and utilities they afford, there is a downside. Any representation of the three-dimensional globe on a flat map is going to introduce some amount of distortion which invariably will increase as the area the map represents grows larger. One of the most crucial arts practiced by the geographer is the selection of an appropriate map projection to best accommodate the purpose a given map is designed to serve. A good geographer will choose a map projection that minimizes distortion of relevant geographic characteristics for an appropriate scale and extent. And whereas a geographic coordinate system is used to index a location on the globe, a projected coordinate system will be used to find locations on a map. On the globe, coordinates specified angular values, but map coordinates represent linear quantities, associated with units such as meters or nautical miles.
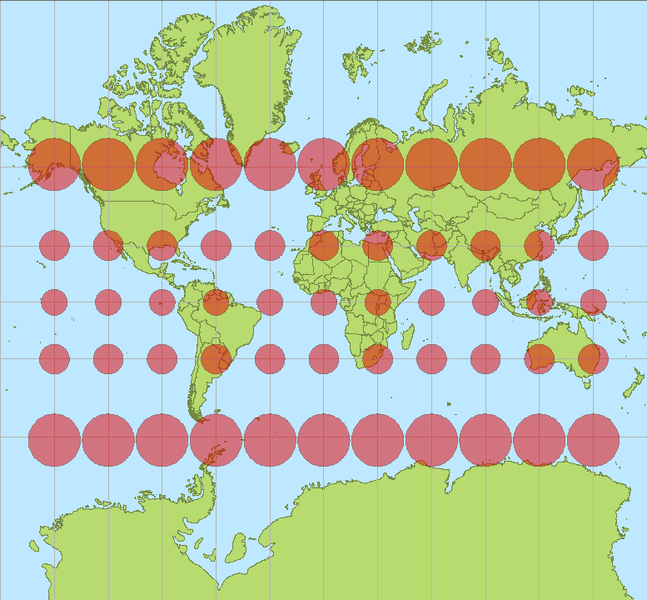
Images by Stefan Kühn, CC BY-SA 3.0
The gold standard for geographic coordinate systems would seem to be the World Geodetic System, the latest revision of which goes by the shorthand WGS 84. This is the reference coordinate system used by the Global Positioning System, and is regularly used in applications that span cartography, geodesy and navigation. It is commonly represented by the European Petroleum Survey Group code EPSG:4326. It is this coordinate system that denominates features on global raster data sets such as Google Earth, Celestia and NASA World Wind. It is very easy to encounter data geospatially registered with this coordinate system.
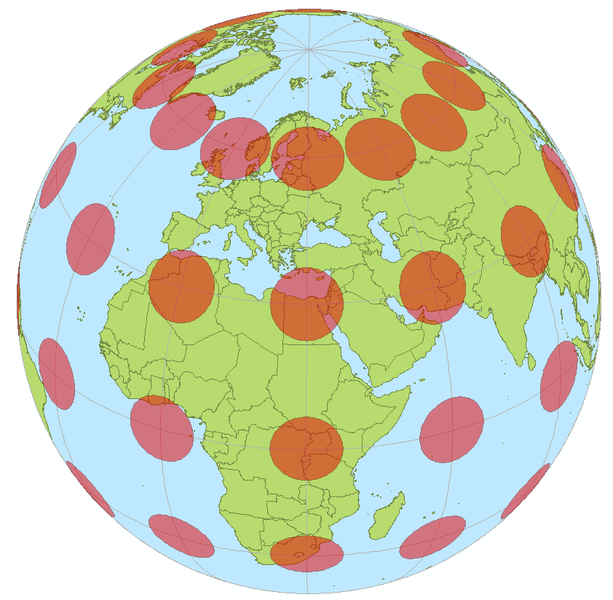
It is very easy to forget that the simple act of viewing such data on a computer screen is in effect a distortion-inducing projection of the data and its geographic, spherically based coordinate system. Actually it's the simplest projection that there is, the plate carrée or geographic projection, which has been around for almost as long as globes have been. Basically, the projection lets longitude represent the x ordinate values and latitude the values along the y axis. The graticule thus forms a regular lattice of constantly spaced vertical straight lines mapping meridians perpendicularly crossed by constantly spaced horizontal lines representing parallels. This projection distorts both area and shape, rendering it of little use for most navigation or mapping applications. However, the advantage of such a particularly simple relationship between an x,y map coordinate – think image pixel – and a geographic location on Earth has made this geographic projection a standard of sorts for global raster data sets (such as those utilized by the previously mentioned Google Earth, Celestia and World Wind). Just keep in mind when dealing with a projection like this that the Earth is round; it's just convenient to sometimes imagine it as flat.
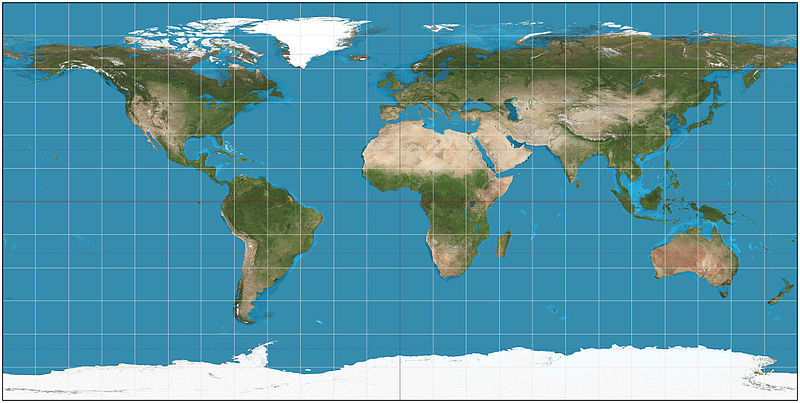
Image by Strebe, CC BY-SA 3.0