The Oil & Gas Industry Looks to Prescriptive Analytics To Improve Exploration and Production
Image Processing, Machine Learning and Integrated Analysis of Unstructured Data Will Help Find and Produce Petroleum
Anonym
Expectations that the United States would once again become the world's largest oil producer appear to have proved true this year. We are in the midst of the shale boom, something which I could have only dreamed of back in the oil bust days of the 1990's when I worked in the geophysical industry processing seismic data. The business was pretty lean back then, but that economic situation was driving a wonderful revolution in the technology that is used in the exploration for and production of oil and natural gas. The focus of that time seemed to be centered on interactivity and integration. It was all about bringing the various data together in one place and providing powerful, interactive tools running on scientific workstations to the geoscientists and engineers working to find and exploit hydrocarbon resources.
Geologists and geophysicists rely on data from existing wells for their ground truth. It is only where the surface has been drilled into that we have direct knowledge of the constituent rocks and structure of the subsurface. But the information concerning the well is accurate only for a very small, well-defined area. The Earth is big, and wells are costly to drill. It's necessary to use interpretation techniques to extrapolate the data between wells, introducing considerable subjectivity into the analysis. The desire is to visualize the subsurface with greater degrees of clarity and resolution. The most cost-effective technology for doing that has long involved the imaging of seismic data.
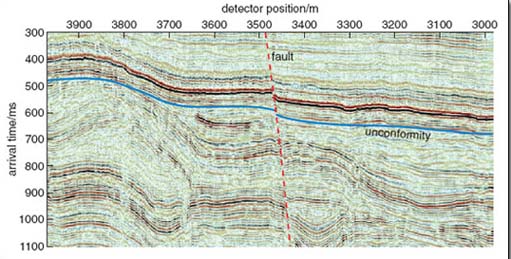
An interpreted seismic section.
From Earth's physical resources: Petroleum. An OpenLearn chunk used by permission of The Open University copyright © 2010. CC-by-NC-sa
Seismic data is produced by introducing acoustic energy into the subsurface and recording the resulting sound waves as they reflect off of different layers and travel back to receivers on the surface. Digital processing of the data can be used to produce an image representing the subsurface. 3D seismic surveys are the most cost-effective way to date of providing insight to the interpretation process.
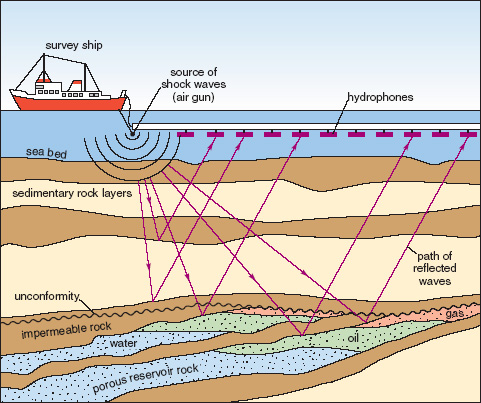
A typical marine seismic survey acquisition layout.
From Earth's physical resources: Petroleum. An OpenLearn chunk used by permission of The Open University copyright © 2010. CC-by-NC-sa
The production coming out of the rich shales of Texas and North Dakota are an indication of how successfully technology in the industry has been brought to bear. Not only are we able to effectively locate such hard to find resources, but extraction and production techniques such as horizontal drilling and hydraulic fracturing enable efficient production from these hard to exploit reservoirs. But the industry sees the need to push on to the next level, and they believe that the ticket to get them there is prescriptive analytics.
This will require the ability to analyze vast quantities of structured and unstructured data in an integrated fashion. The industry is hoping to analyze simultaneously images from well logs, seismic reports, video and image feeds collected down hole and during drilling and fracking operations, audio recording collected by various field sensors, and text notes collected from operations as well as a wealth of numeric information collected in place. This is a multi-interdisciplinary domain, combining different approaches to interpreting disparate data sets as an integrated whole. Image interpretation will rely on machine learning and computer vision leading to pattern recognition of processed data.
Ultimately, prescriptive analytics means being able to derive from analysis what is going to happen when, and how to best prepare for and optimize the future. In terms of petroleum exploration and production, one would hope to be able to better predict the future performance of various wells in an oil field. Companies will better know where to drill as well as, maybe most importantly, where not to. That's really what the whole endeavor has always been about, making prescriptive analytics a seemingly perfect fit.
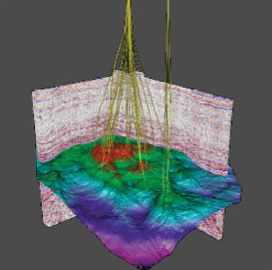
3D visualization of integrated seismic and well data.
From Earth's physical resources: Petroleum. An OpenLearn chunk used by permission of The Open University copyright © 2010. CC-by-NC-sa
Prescriptive analytics holds promise beyond that. By creating a holistic, integrated view of data collected from in-field production equipment, failures of pumps and other machinery can be better anticipated and mitigating actions prescribed to minimize production losses. Prescriptive analytics may be used to predict corrosion and fatigue failures in pipelines and prescribe preventive maintenance by analyzing video and other data collected by robotic devices that travel inside the pipeline network.
Better decisions mean better exploration and production results with fewer resources expended, and less impact on the environment. The winners of the race to the future will be those that are best able to utilize advances in technology to most efficiently and safely extract, product and deliver oil and gas to market. Just as it has always been.