Using ENVI Tools to Create Labeled Images for Deep Learning
With the release of the ENVI® Deep Learning module, the process of extracting features from images has become much simpler for remote sensing users. As I discussed in my last blog article, part of this simplicity comes from the ability to use ENVI’s preprocessing and spectral tools to create labeled datasets. Why spend countless hours tediously drawing regions of interest (ROIs) around example features, when you could partially automate the labeling process? In this article I will show an example where I used band ratio images to create labeled datasets for training and validating a deep learning model to look for man-made ("built-up") features in aerial imagery.
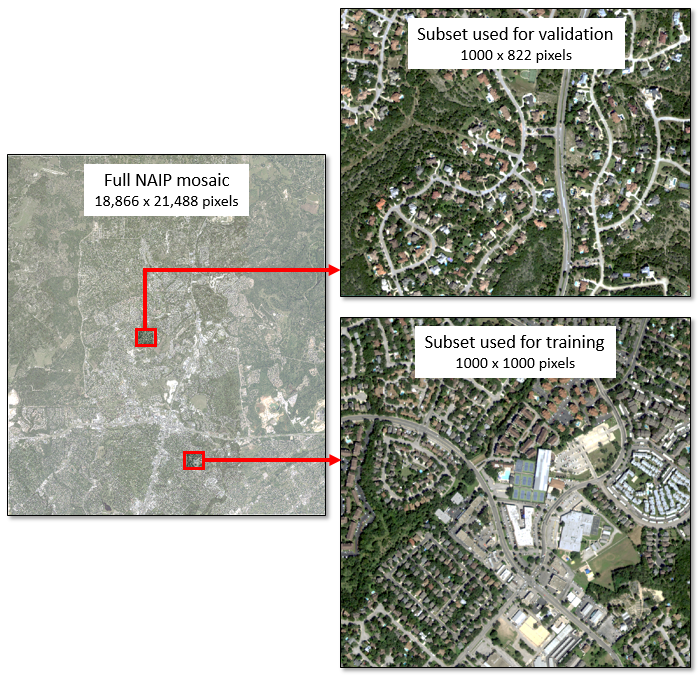
I downloaded 16 adjacent National Agriculture Imagery Program (NAIP) images from the USGS EarthExplorer site. These were 1-meter, four-band images of a region in northern San Antonio, Texas, acquired in October of 2016. I used the ENVI Seamless Mosaic tool to quickly create a georeferenced mosaic from the images. Then I created two spatial subsets from the mosaic: one for training and another for validating that the deep learning model correctly learns the features I am interested in. My ultimate goal was to extract from the NAIP mosaic all of the roads, disturbed earth, structures, and other features that indicated human development.
Normally I would draw polyline and polygon ROIs over all of the built-up features in the training and validation images. However, I tried a faster process instead:
1. Create a blue / near-infrared band ratio image that highlights these features while suppressing the spectral signature of vegetation.
2. Apply a 5% linear stretch to the ratio image using Run Task > Linear Percent Stretch Raster in the ENVI Toolbox. This provided even more contrast between the built-up features and the background.
3. Create an ROI threshold layer from the stretched image, where pixel values above 200 are highlighted in red.
4. Use the Run Task > Convert ROIs to Classification task in the ENVI Toolbox to convert the result to a classification image.
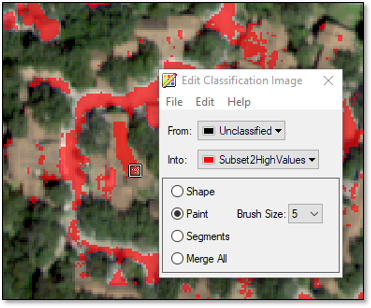
The result provided a good starting point for identifying the feature pixels in the training and validation images, without requiring any drawing or labeling by hand. The result was not perfect, so some further but minimal editing was needed. I used the Edit Classification Image tool to remove incorrectly classified pixels such as shadows and water, and I added several more pixels to the “built-up” class.
5. Use the Deep Learning > Build Label Raster From Classification tool to create a label raster for training a deep learning model.
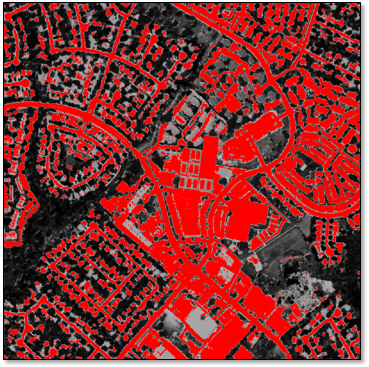
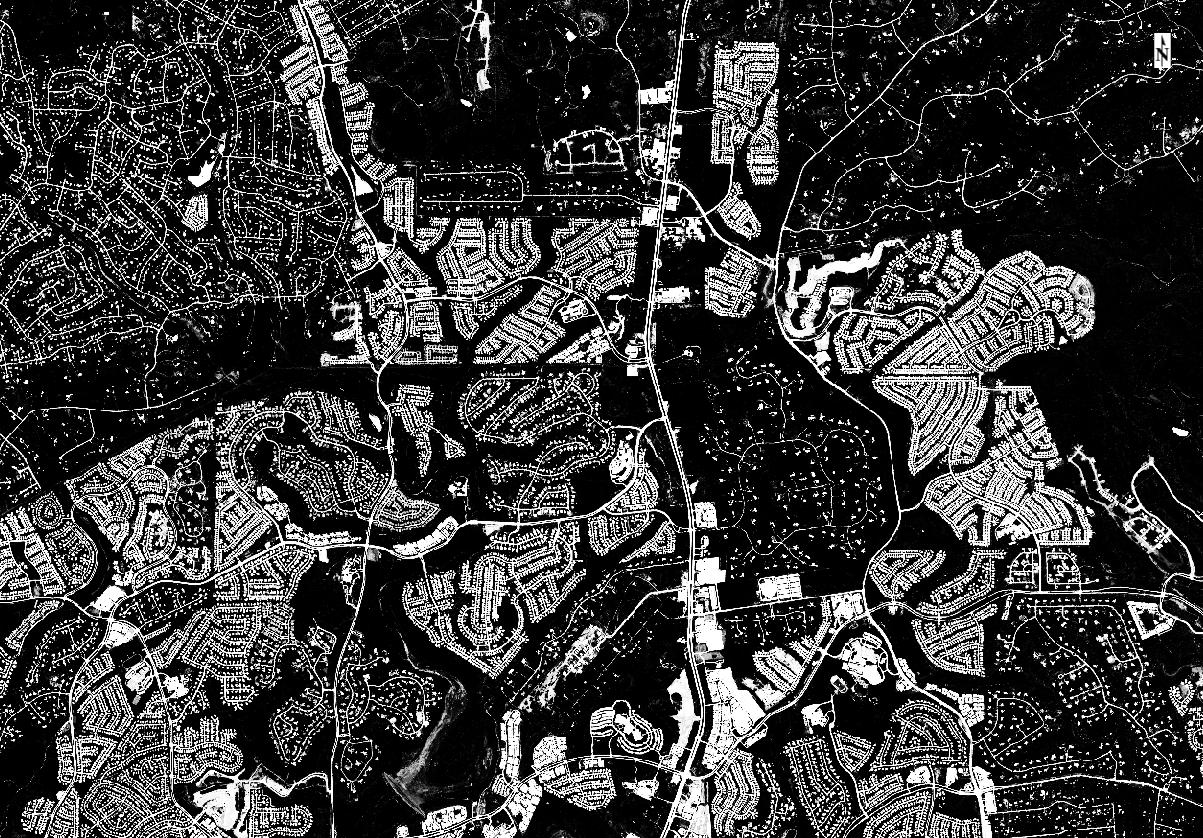
The entire process of steps 1-5 only took about 20 minutes, plus it had the added benefit of defining the shapes of the built-up features rather than just marking their locations. Training a deep learning model to identify these features took an additional 30 minutes on my system with an 8 GB graphics card. Then I used the trained model to classify the entire NAIP mosaic, which only took a few minutes. Here is a sample of the resulting class activation image. The model learned to identify nearly all of the built-up features, shown in white below:
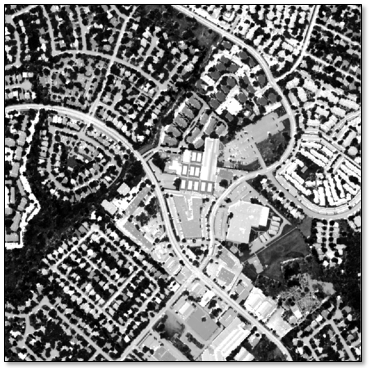
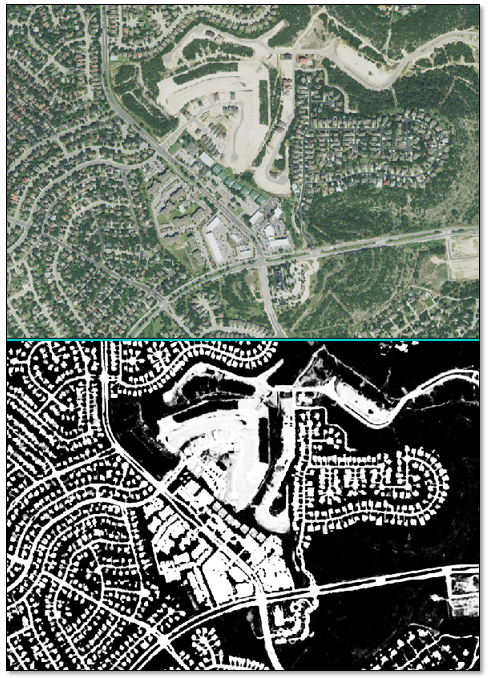
Here is a comparison between a NAIP mosaic sample and the corresponding class activation image:
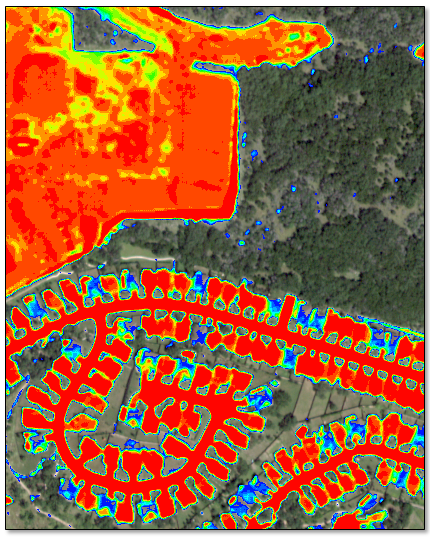
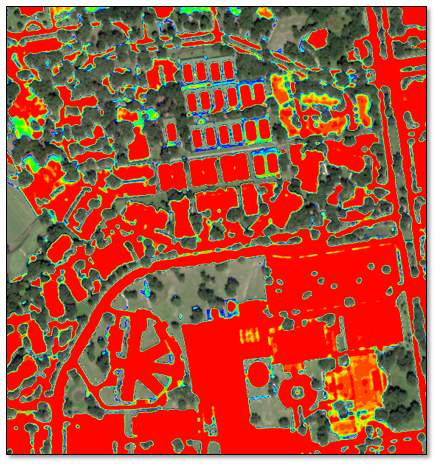
Applying a raster color slice to the class activation image shows the areas with the highest probability (red-orange) of belonging to the “built-up” class. Similar models can be trained and applied to extract rooftops and impervious surfaces from images that cover wide geographic areas.
In closing, the wide variety of image-processing tools in ENVI can help speed up the process of preparing data for deep learning. One example would be using target detection tools such as Adaptive Coherence Estimator (ACE) or Matched Filter to label features of interest in hyperspectral imagery. Other spectral tools that can effectively highlight objects in imagery include Spectral Indices, Principal Component Analysis, and Dimensionality Expansion.