Using Satellite Imagery to the Aid Fishing Community
Roffer's Ocean Fishing Forecasting Service (ROFFS™) uses IDL® and ENVI® software and routines to take raw NOAA, NASA and ESA (European Space Agency) satellite data and process them to a user-friendly format to analyze for private industry and scientific research needs. More specifically we developed IDL and ENVI code and utilized their routines to download real-time satellite data and then georeference, re-project, and calibrate the images and output them to a usable format. The two case studies outlined below use IDL and ENVI to help fisherman find the most productive areas to fish, and tracking contaminated runoff from Hurricane Florence.
Guiding Fisherman to the Most Productive Regions
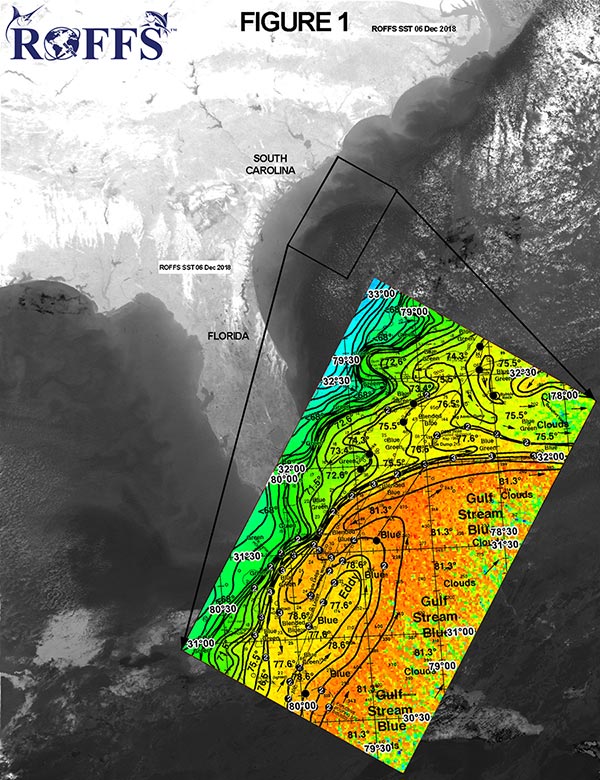
Figure 1 is a schematic showing the ENVI outputted sea surface temperature (SST) image of the Southeast United States region in grayscale (white = clouds, darker grey = warmer water). The outlined region in black is an example of a predefined cut out area offshore of South Carolina and Georgia within the Gulf Stream region. We further analyze the ocean conditions in this cut out area using internal techniques and provide an overall mapped product for the fisherman (shown in color). ROFFS™ incorporates a number of different satellite data products to derive the most important ocean parameters to guide the fishing community to the better offshore conditions to be most productive for their target species. The end result is blown up and shown in color where we provide a customized map displaying ocean frontal boundaries, water current flow, bottom structure, eddy features, SST and water color overlaid on detailed bottom structure and georeference information. Finally, based on all these factors and experience we pinpoint the locations with dots and stability information to where the best spots to fish are located. This saves our clients time and fuel and makes fishing trips more efficient and enjoyable.
Tracking Contaminated Runoff into the Ocean from Hurricane Florence
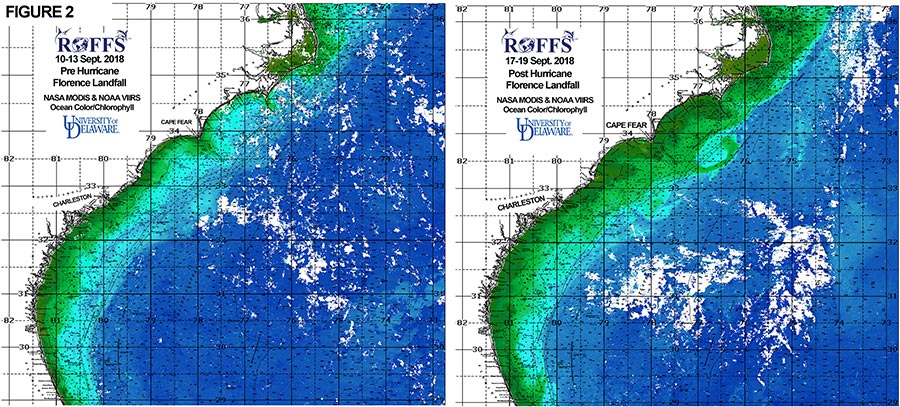
Figure 2 is an example of environmental monitoring ROFFS™ does for the scientific and government entities. Hurricane Florence made landfall along the east coast of the United States on September 14th, 2018 then lingered in the area of coastal North and South Carolina for a few days dumping historical amounts of rain. The flooding associated with Florence eventually made its way into the ocean via rivers and inlets. These floodwaters contained large amounts of pollutants related to human, animal and commercial waste that spewed into the ocean contaminating the water and habitat for hundreds of inshore and offshore species. ROFFS™ was able to use similar IDL and ENVI routines and methods described above to process and analyze NASA and NOAA ocean color/chlorophyll satellite data to assist in producing these images you see in Figure 2. On the left is the ocean conditions a few days before Hurricane Florence and on the right is the ocean conditions a few days after Florence made landfall. Of note is the larger extents of darker green and brown water directly offshore of North and South Carolina in the image on the right. This is the satellite signal of this polluted floodwater outflow into the Atlantic Ocean. This contaminated water is important to monitor for a number of reasons. For instance, the resulting data is of importance for ocean policy makers, fish stock assessment researches and fisheries managers just to name a few.
About the Author: Guest blogger Matthew Upton is President/Owner of ROFFS™, a small environmental consulting company that specializes in analyzing satellite data within the ocean to accommodate the fishing community. ROFFS™ also is involved with the oil and gas industry and scientific community with monitoring the ocean conditions for offshore rigs and research and development projects. For more information on ROFFS™ please visit us at www.roffs.com