Using SWIR and LWIR Imagery to Analyze Forest Fires
Anonym
Recently I've been interested in the utilization of multispectral imagery acquired in the SWIR and LWIR wavelength regions when analyzing natural disasters such as forest fires. Obviously the thermal properties captured in the LWIR wavelengths help identify hotspots and distinguish high (colder) clouds from low (warmer) smoke. Furthermore, light in the SWIR wavelength region can penetrate haze and certain types of smoke. Consequently, SWIR-based imaging can provide the ability to "see through" smoke to better analyze the active portion of a forest fire and identify hotspots.
There's a wide variety of scenarios where remote sensing analysis can help understand a wildfire ranging from during-fire disaster response support to post-fire forensic analysis. Obviously in the during-fire scenario it is absolutely critical to acquire imagery, derive information and get it into the hands of the personnel fighting the fire as soon as possible. Active forest fire analysis is where the airborne ISR systems and services provided by companies such as Range and Bearing excel since imagery of a wildfire begins to lose its usefulness immediately after being acquired. Sensor platforms such as WorldView-3 also provide multispectral imagery covering the SWIR wavelengths which can provide during-fire intelligence (depending upon data availability timeframe) and post-fire forensic analysis as discussed in DigitalGlobe's recent blog post:
Revealing the Hidden World with Shortwave Infrared (SWIR) Imagery
Since I do not have access to RAB or WV-3 data of a wildfire at this time I decided to see if I could find a Landsat 8 scene for one of the numerous wildfires that occurred in 2014. The Landsat 8 OLI/TIR sensor platform and availability of the data for free on USGS EarthExplorer never ceases to amaze me as I was able to find a relatively cloud-free scene of the Chelaslie River fire in British Columbia acquired on 03 Aug 2014. Here is a screenshot of a simple RGB band combination image from this dataset:
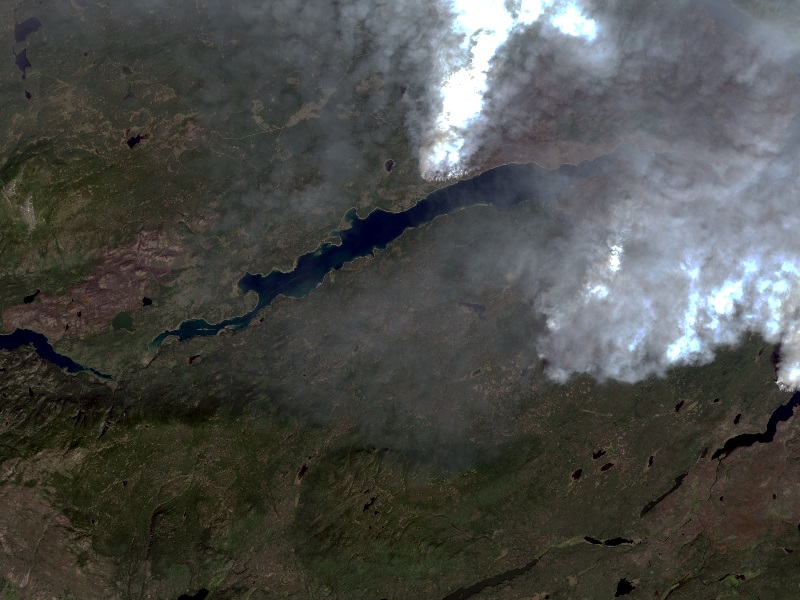
Image data downloaded from USGS EarthExplorer
While active forest fire smoke is clearly visible without aggressive stretching it is difficult to visually identify the burned areas and other features in this image. So let's take the two SWIR bands and display them in a raster layer with R=SWIR2 | G=SWIR1 | B=SWIR2 band combination:
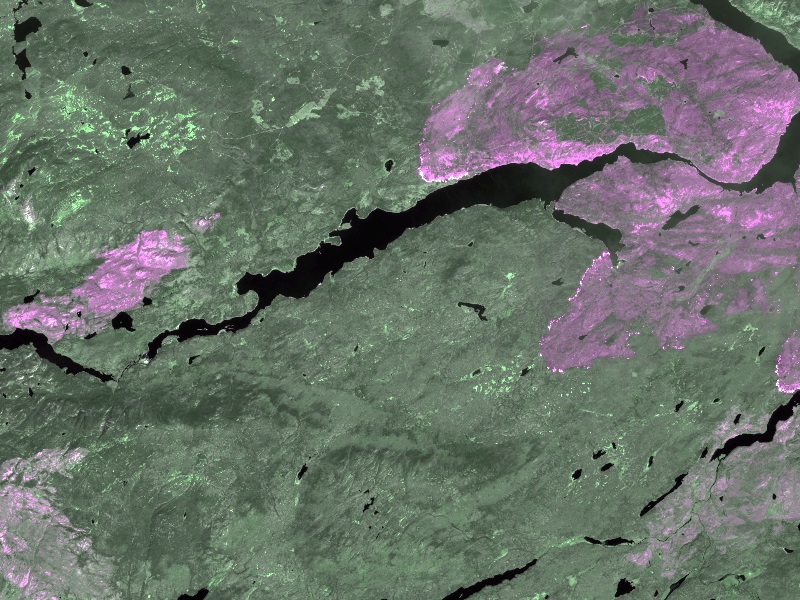
Image data downloaded from USGS EarthExplorer
Notice the smoke has almost entirely disappeared and the burned areas (pink) and active fire (white) are clearly visible. For example, look at the patch of forest that burned along the left-hand side of the image that is not readily apparent in the visible wavelengths. Now let's take a look at band TIR1 with a rainbow color table applied:,/p>
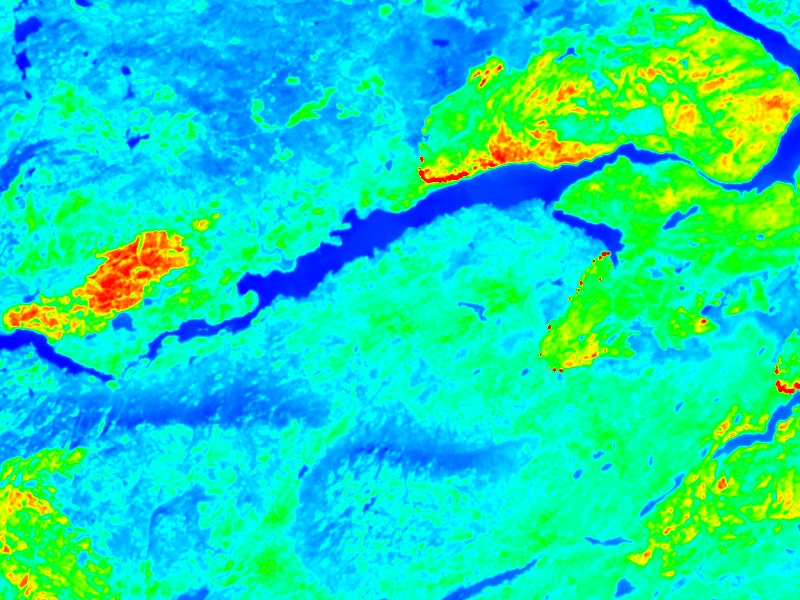
Image data downloaded from USGS EarthExplorer
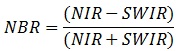
I was quite surprised by the thermal intensity of the burned area along the left-hand side which does not currently have smoke emanating in the RGB image. So far I've been illustrating the power of simple visual interpretation of this imagery but you can, of course, perform image processing analysis to help derive intelligence products from multispectral datasets. One useful analysis technique is the calculation of spectral indices such as the Normalized Burn Ratio now available in ENVI 5.2 within the new "Spectral Index" tool and associated programmatic API. The Normalized Burn Ratio (NBR) spectral index has a fairly simple formula:
When Normalized Burn Ratio is calculated it produces a raster image where darker pixels indicate burned areas:
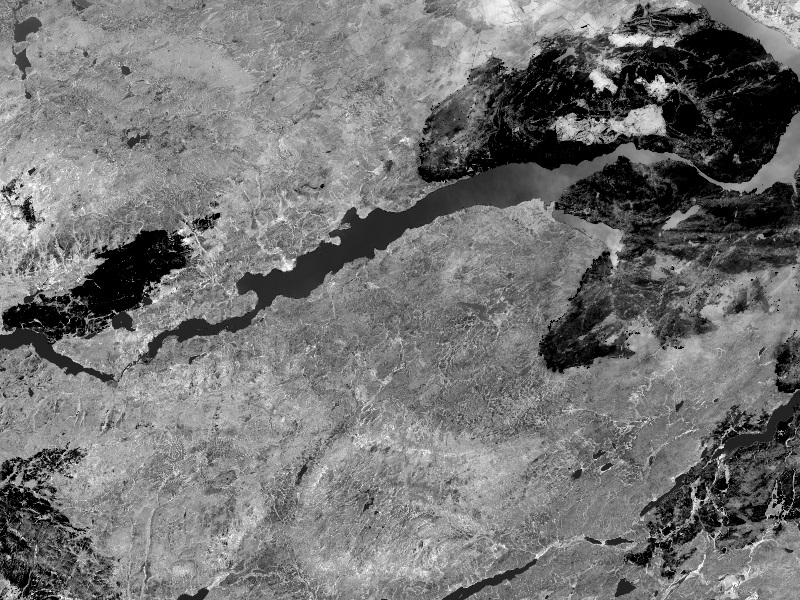
Image data downloaded from USGS EarthExplorer
The real power of the Normalized Burn Ratio spectral index is exhibited when you create pre-fire and post-fire NBR images then subtract the post-fire NBR raster from the pre-fire NBR raster to create a Differenced Normalized Burn Ratio (DNBR) image that indicates burn severity. This DNBR = PreFireNBR - PostFireNBR raster calculation can easily be executed using the "Band Math" tool within the ENVI software. Unfortunately I was unable to find a good post-fire Landsat scene as most have either clouds or snow obscuring the burned areas but hopefully we'll get a good scene this upcoming summer to perform forensic analysis on the burn severity of the Chelaslie River forest fire.