What can we look forward to from WorldView-3
This week we welcome Owen Cox as a guest blogger - a Programming Consultant helping European customers to get the most out of ENVI
Anonym
DigitalGlobe is a big player in the provision of satellite imagery, so it’s no surprise that the earth observation community is looking forward to the launch of their new satellite, WorldView-3. The company already operates a constellation of satellites that are widely used in commercial image analysis (QuickBird, WorldView-1 and WorldView-2, http://www.digitalglobe.com/about-us/content-collection#overview). But besides the obvious benefits of more satellites giving greater coverage of the Earth’s surface, what other benefits will WorldView-3 be bringing to the party?
Well first, a bit of background. Like its sister satellites QuickBird and WorldView-2, WorldView-3 (WV-3) is multispectral. This means that it is observing light reflected from the Earth at a number of different frequency bands across the electromagnetic spectrum (unlike WV-1 which only observes one bands of frequencies, i.e. panchromatic). Typically these bands are sited within the red, green and blue portions of the spectrum, with a fourth band within the Near Infra-Red (NIR). The three RGB bands allow us to produce images as the human eye would see, whilst the NIR band is useful for delineating features such as land/sea boundaries or identifying clouds -- basically any feature where we’d expect a sudden change in temperature. This is the approach of QuickBird and many other commercial satellites.
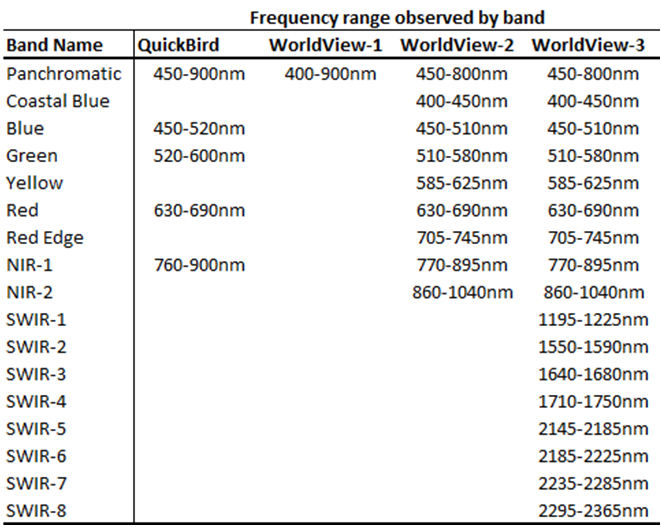
WorldView-2 takes this approach a little further, by utilising 8 bands in the Visible and NearInfra-Red spectra (VNIR). I’ve listed the bands used by all of these satellites in the accompanying table. We can see that as well as the standard RGBand NIR, WV-2 has some additional bands -- Coastal Blue, Yellow, Red Edge and a second NIR band. Each of these bands is chosen to be sensitive to a particular feature on the surface. For example, the Coastal Blue band is more sensitive to moisture within an image than the traditional Blue band, so it can be used to improve on water depth measurements around harbours. These additional bands really help with image analysis because the additional information allows for more accurate image classification and segmentation which would be carried out with analysis software such as ENVI.
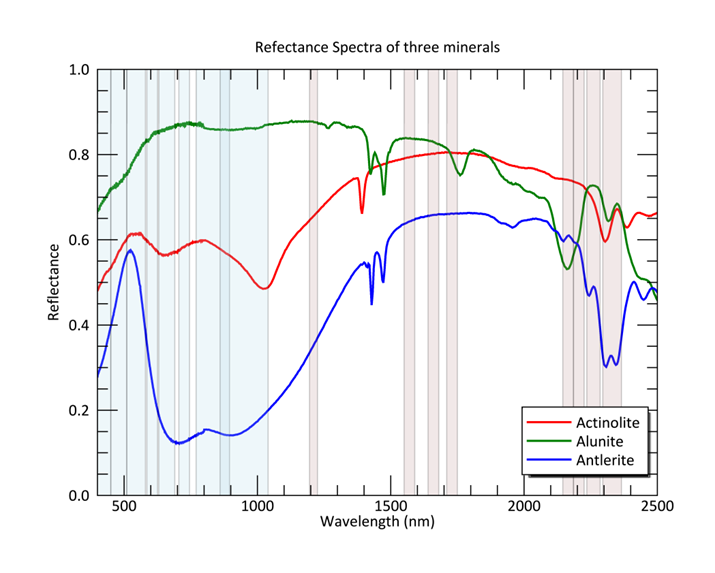
WorldView-3 takes the advances made with WorldView-2 the next step forward and includes 8 more bands within the Short-Wave Infra-Red (SWIR) region of the spectrum (http://www.satimagingcorp.com/satellite-sensors/WorldView3-DS-WV3-Web.pdf), in addition to the VNIR channels of WorldView-2 (also listed in the table). This allows WV-3 to observe a much wider range of the electromagnetic spectra than most other commercial satellites, and will allow us to start looking for the individual spectral signatures of materials. The accompanying plot shows the spectral signatures of three minerals. The light blue regions on the plot denote the VNIR bands covered by WV-2and WV-3. The light red regions denote the SWIR bands covered by the 8 new WV-3 bands. This shows just how much further the new bands penetrate into the electromagnetic spectrum. The spectral profiles of each pixel in an image can be compared to a spectral library (such as the reflectance spectras shown) to classify what material is contained within that pixel.
This type of automated spectral classification is commonly carried out in ENVI with hyperspectral data (from satellites containing hundreds of spectral bands) which can sometimes be costly to acquire. However, the ability to remotely monitor materials is invaluable to a great number of industries for example in forestry applications where we see users wanting to monitor tree health and pest infestation in remote regions. WorldView-3 brings a limited version of this capability to users at a reduced price, so we still won’t expect the accuracy of a hyperspectral satellite, but it really is a step beyond the features we could extract from multispectral data. So, I’ll stick with Digital Globe’s marketing and refer to it as ‘super-spectral’.
WorldView-3 will be launching in the next few months, so the first data is likely to be available at the beginning of 2015. As a partner of Digital Globe, we’ve been preparing for this. In fact, our parent company developed the SWIR sensor aboard http://www.exelisinc.com/news/pressreleases/Pages/Exelis-delivers-first-of-its-kind-commercial-payload-to-DigitalGlobe-for-WorldView-3-satellite.aspx). The data will be able to be loaded into ENVI as soon as it’s available, so I advise you to keep an eye out for further updates because this instrument looks like it will be a great addition.