X

NV5 Geospatial Blog

Each month, NV5 Geospatial posts new blog content across a variety of categories. Browse our latest posts below to learn about important geospatial information or use the search bar to find a specific topic or author. Stay informed of the latest blog posts, events, and technologies by joining our email list!


NV5 at ESA’s Living Planet Symposium 2025

NV5 at ESA’s Living Planet Symposium 2025

9/16/2025

We recently presented three cutting-edge research posters at the ESA Living Planet Symposium 2025 in Vienna, showcasing how NV5 technology and the ENVI® Ecosystem support innovation across ocean monitoring, mineral exploration, and disaster management. Explore each topic below and access the full posters to learn... Read More >

Monitor, Measure & Mitigate: Integrated Solutions for Geohazard Risk

Monitor, Measure & Mitigate: Integrated Solutions for Geohazard Risk

9/8/2025

Geohazards such as slope instability, erosion, settlement, or seepage pose ongoing risks to critical infrastructure. Roads, railways, pipelines, and utility corridors are especially vulnerable to these natural and human-influenced processes, which can evolve silently until sudden failure occurs. Traditional ground surveys provide only periodic... Read More >

Geo Sessions 2025: Geospatial Vision Beyond the Map

Geo Sessions 2025: Geospatial Vision Beyond the Map

8/5/2025

Lidar, SAR, and Spectral: Geospatial Innovation on the Horizon Last year, Geo Sessions brought together over 5,300 registrants from 159 countries, with attendees representing education, government agencies, consulting, and top geospatial companies like Esri, NOAA, Airbus, Planet, and USGS. At this year's Geo Sessions, NV5 is... Read More >

Not All Supernovae Are Created Equal: Rethinking the Universe’s Measuring Tools

Not All Supernovae Are Created Equal: Rethinking the Universe’s Measuring Tools

6/3/2025

Rethinking the Reliability of Type 1a Supernovae   How do astronomers measure the universe? It all starts with distance. From gauging the size of a galaxy to calculating how fast the universe is expanding, measuring cosmic distances is essential to understanding everything in the sky. For nearby stars, astronomers use... Read More >

Using LLMs To Research Remote Sensing Software: Helpful, but Incomplete

Using LLMs To Research Remote Sensing Software: Helpful, but Incomplete

5/26/2025

Whether you’re new to remote sensing or a seasoned expert, there is no doubt that large language models (LLMs) like OpenAI’s ChatGPT or Google’s Gemini can be incredibly useful in many aspects of research. From exploring the electromagnetic spectrum to creating object detection models using the latest deep learning... Read More >

1345678910Last
«September 2025»
SunMonTueWedThuFriSat
31123456
78910111213
14151617181920
21222324252627
2829301234
567891011
14465 Rate this article:
3.7

Where in the World Am I?

Anonym

When analyzing satellite or airborne imagery, we often know the general location of our study area. But we may not know exactly where a particular image is located, relative to nearby cities or geographic features (oceans, mountain ranges, etc.) This article will provide some tips for finding your way around in ENVI that you may not have been aware of.

Here is an example. At first glance, you probably wouldn't know where this image was located:

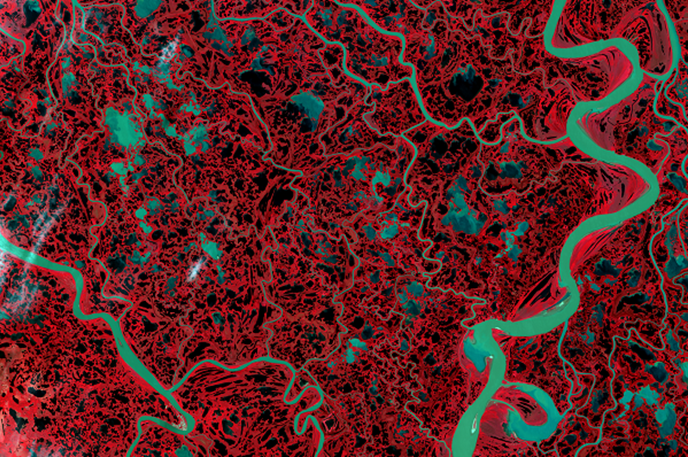
Landsat 8 color-infrared composite, acquired from USGS EarthExplorer. Data available from the U.S. Geological Survey.

Landsat images are georeferenced to a standard map projection, so you can display geographic coordinates in the ENVI status bar as you explore the image. The status bar is located along the bottom of the ENVI application. Right-click in any segment of the Status bar and select Lat/Lon Decimal Degrees.

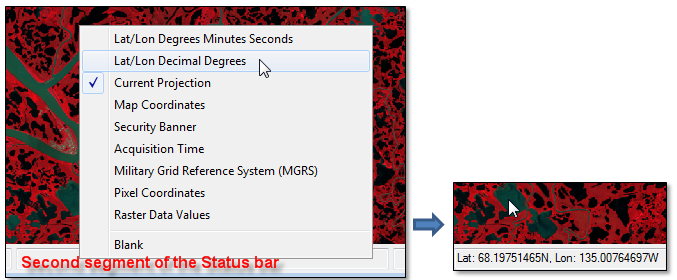
The Cursor Value tool offers a similar method. From the geographic coordinates, you can see that the image is at a high latitude (68ºN). The image reveals geomorphic features that are common in coastal floodplains such as braided river networks and thousands of melt ponds and lakes. 

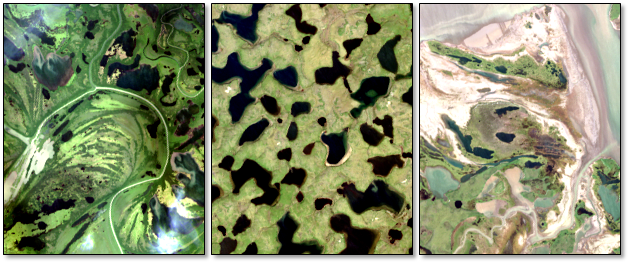
True-color snapshots of various floodplain features from the Landsat 8 image

Still, this is not enough information to tell where the image is located. Enter the Reference Map Link tool.

This handy feature is located under the Views menu, or you can use the Alt+M keyboard shortcut to start it. The underlying technology and base maps were developed by Esri® via their ArcGIS API for Javascript. The Reference Map Link dialog displays a base map with a blue dot that corresponds to the location of the scene center:

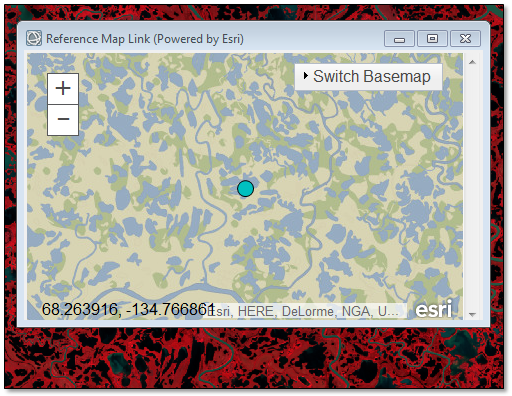
The lower-left corner of the map displays the updated coordinates as you move around the map. Here are some tips for using the Reference Map Link:

  • Click the + and - buttons, or use the mouse wheel, to zoom in or out.
  • Click and drag to pan around the map.
  • Click and drag the lower-right corner of the window to resize it.
  • Click the Switch Basemap menu to select a different base map.
  • The Reference Map Link is actively linked to the ENVI view. If you change the location in the view, or if you zoom or rotate the image, the map will update to reflect that change.

As you zoom out, a blue border shows the view extent:

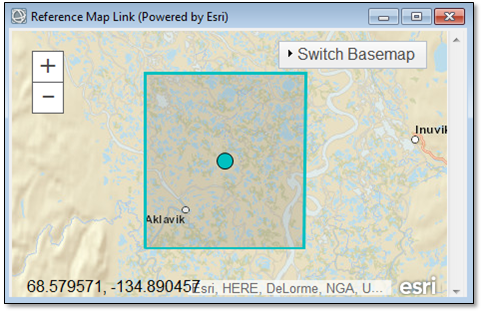
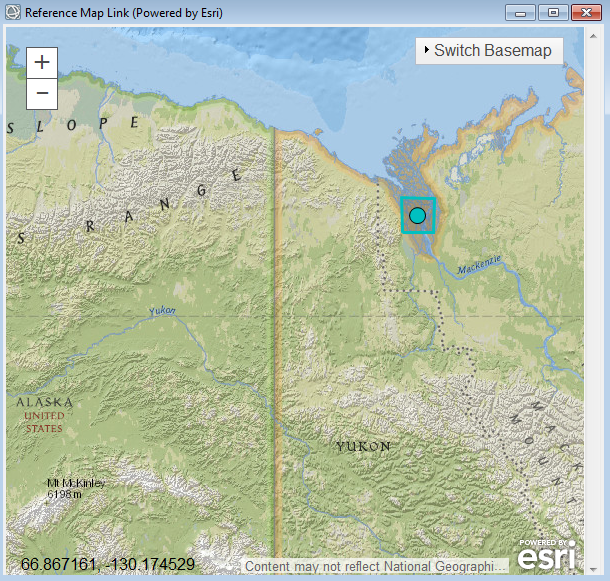
This particular image is located in the Mackenzie River drainage basin, Northwest Territories, Canada. The view extent and scene center are shown in the following figure that uses a National Geographic base map:

The Reference Map Link is the simplest way to determine the geographic location of your imagery. You can also overlay vector coastlines, countries, and provinces on an image using the File > Open World Data menu options. Or, use the menu option File > Chip View to > Google Earth to open the extents of the current image view in Google Earth.

Have fun exploring!

Please login or register to post comments.