Where on Earth Am I?
Using Global Data to Determine Geopositional Context
Anonym
When I start a project that involves geospatial context this is quite often the first question that pops into my head. When working in the field this question is most commonly answered through the use of a hand-held GPS device, smart phone with location services, etc. but the extent of my "working outside" these days seems to be limited to the walk from the parking lot into the airport terminal. Instead, this question most frequently arises when I am sitting at my desk using geospatial software and I open datasets for the first time but do not have prior knowledge of their exact geographic location or feature content.
In some cases there is a clue in the file/folder name, metadata or other project information I was given that provides me some geopositional context (especially if the data covers a populated area). More often I find myself working with a collection of multiple datasets and all I know is they are located in "California's central valley" or the "rain forest in Brazil". Another scenario where this question frequently arises is exploring data in a massive historical archive. Admittedly an enterprise-scale data cataloging and management system would be of great utility in this situation but that's a subject for another blog post.
For example, I recently encountered a folder containing multiple files named "LC81520282013319LGN00". What I know from the filename structure is it's a Landsat 8 OLI + TIRS scene, path 152, row 28, acquired in 2013 on the 319th day of the year. I'm sure some of you have the WRS path/row grid memorized but I don't have the foggiest clue where this dataset is located. What I really need is a way to quickly open the dataset, view the imagery and perform a quick visual interpretation of the features on screen.
When determining dataset geolocation on a global scale the use of contextual basemaps, orthoimagery, graticules or vector features with rich attributes can be extremely helpful. This technique is nothing new and most geospatial software packages have functionality to help users ascertain geopositional context including ENVI Classic's "Create World Boundaries" tool. However, we now have our new ENVI 5 application with its modern user interface and multiple layer display so we need to provide access to recent data with a more intuitive user experience.
As a product manager I receive a lot of feedback from our users and I have heard them struggle with global geopositional context when working in our software. Sure, we have a mouse cursor location display with geographic lat/lon or MGRS coordinates, but that doesn't really help visualize the geolocation of your data. Consequently, as part of the ENVI 5.1 project we added a variety of global datasets to the software installation including a Natural Earth global shaded relief image, Natural Earth global vectors (Shapefile format with attributes), and the GMTED2010 global digital elevation model. Furthermore, we also provided a convenient mechanism to open and display these datasets from the "File > Open World Data > ..." application submenu.
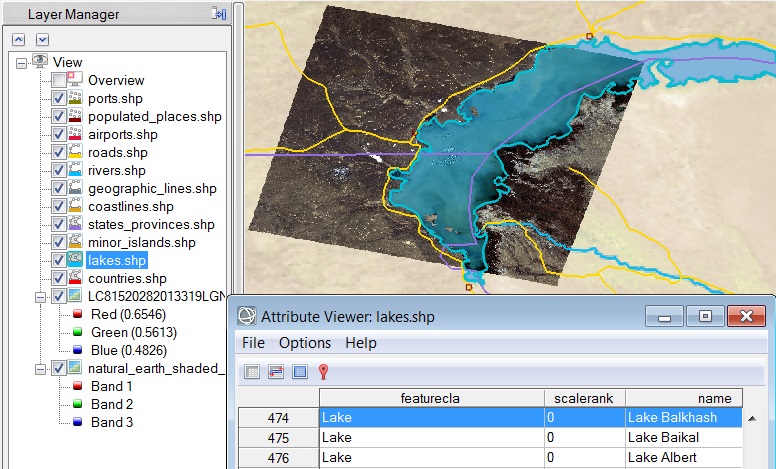
Using our new world data I was able to open the aforementioned Landsat 8 scene and in under a minute determine it covers the region of Lake Balkhash in the southeast corner of Kazakhstan (see screenshot below). Many people ask me what my favorite new feature is in our ENVI 5.1 release and while there is a ton of amazing functionality ranging from the Seamless Mosaic workflow to the completely new region-of-interest (ROI) framework I always come back to the world data since I use it almost every day. Last but not least, we also recently added keyboard shortcuts that you can customize (File > Shortcut Manager) and I've added my own "Basemap" shortcut (Ctrl + B) which opens and displays the global shaded relief image in 2 simple keystrokes!