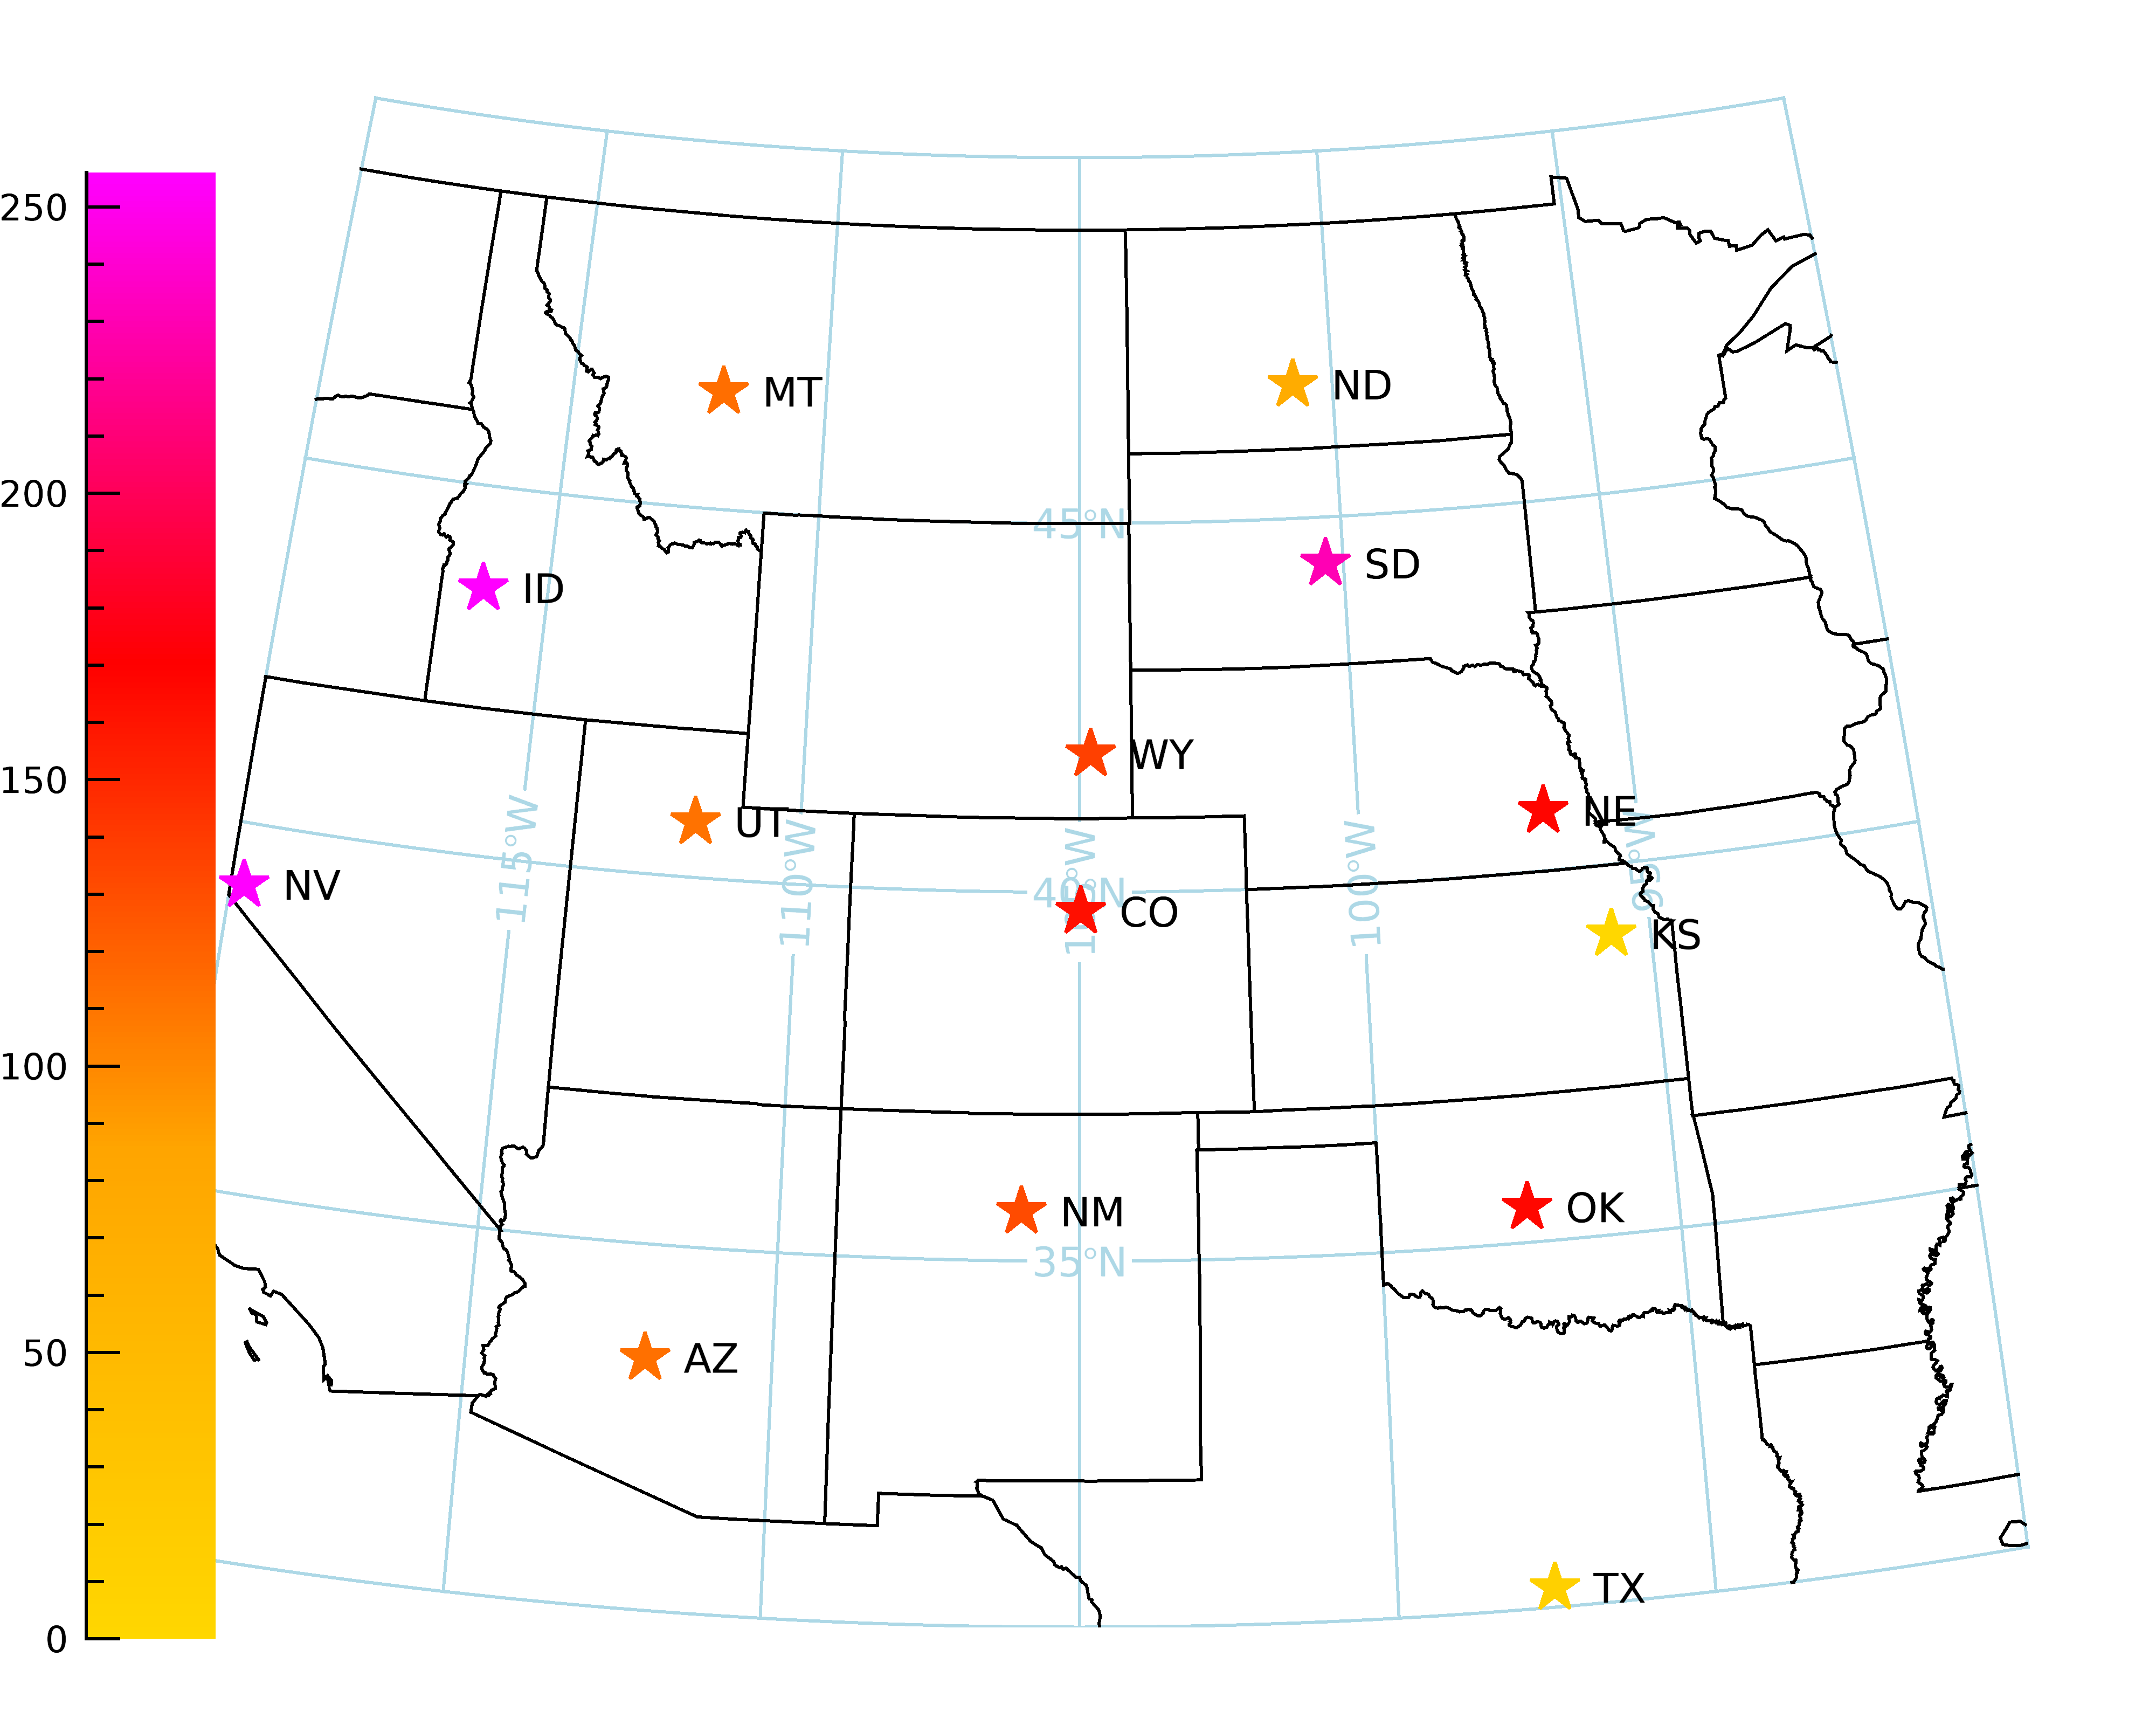
Yes it is possible to draw all symbols in one call to the SYMBOL function and each to have a unique color. Just using the SYM_COLOR property as that can take vectors of color names or RGB triplets. See the PRO code example below for an idea of how to do this using RGB triplets. You will need to do the work map each data value you want to plot to a specific color, though.
m = MAP('Orthographic', COLOR='light blue', $
LIMIT=[30, -120, 50, -90], $
CENTER_LONGITUDE=-105, CENTER_LATITUDE=40)
c = MAPCONTINENTS(/USA)
m.mapgrid.ORDER, /SEND_TO_BACK
lon = [-104.98,-104.80,-111.88,-116.22,-112.03, $
-119.75,-100.78,-100.34,-96.68,-95.69, $
-97.54,-97.53,-105.97,-112.07]
lat = [39.74,41.87,40.75,43.61,46.60, $
39.16,46.82,44.37,40.81,39.06, $
35.48,30.27,35.67,33.45]
labels = ['CO','WY','UT','ID','MT','NV','ND', $
'SD','NE','KS','OK','TX','NM','AZ']
magnitudes = bytscl(randomu(seed,n_elements(labels))*100)
ctable = COLORTABLE([[255,215,0],[255,165,0],[255,0,0],[255,0,255]], NCOLORS = 256, /TRANSPOSE)
;Map mantitudes to colorbar
symColors = bytarr(3,n_elements(magnitudes))
foreach mag, magnitudes, idx do begin
symColors[*,idx] = ctable[*,mag]
endforeach
capitals = SYMBOL( lon, lat, 'Star', /DATA, $
/SYM_FILLED, SYM_COLOR=symColors, SYM_SIZE = 2, $
LABEL_STRING=labels )
c = COLORBAR(RGB_TABLE=ctable,ORIENTATION=1, $
POSITION=[0.04,0.05,0.1,0.9])