Analyzing Multitemporal Data in ENVI
Anonym
Last week I co-taught our very first Advanced Geospatial Analytics (AGA) course in our Boulder, Colorado, office. For this course, we decided to develop the content completely from scratch. This allowed us to focus on some of my favorite new tools available in ENVI + IDL for pre-processing, analyzing, and visualizing multitemporal data. The concept of performing multitemporal analysis is not new to remote sensing, but in the latest release of ENVI we have built out a lot of new tools that are powerful in their simplicity and ease-of-use. If you ever have occasion to view and compare multiple images of the same place taken at different times, these tools might be worth knowing about.
Top on my list is the the ENVITask system. The ENVITask system is a relatively new method for performing discrete bits of image processing programmatically through the ENVI object-based API. This programmatic approach to image processing can save a lot of time because you can easily chain together multiple ENVITasks, allowing the output from one ENVITask to become the input to the next. You can also loop through multiple files, so that whatever processing you choose to do, you can repeat for multiple images all at once. ENVITasks were introduced in ENVI 5.1 and the number of available ENVITasks has steadily grown with each subsequent release. At ENVI 5.3, there are over 100 ENVITasks available in the ENVI API. To programmatically run an ENVITask, a user simply needs to define the ENVITask to be executed, define the ENVITask parameters (input files, output file locations, additional task parameters), and execute the ENVITask. For a full list of available ENVITasks, along with examples for calling each individual ENVITask from the ENVI API, please consult our online ENVITasks Documentation Center.
In the case of our AGA course, we used high resolution satellite imagery provided by Airbus Defense and Space to look at agricultural fields in the Central Valley of California. The imagery was collected by the Pleiades 1A and 1B sensors. The following code example shows how we can:
1. Create a list of input Pleiades images to perform processing on
2. Call the the ENVIRadiometricCalibrationTask
3. Call the ENVIQUACTask
4. Call the ENVISpectralIndicesTask
5. Open each file and perform each step of processing
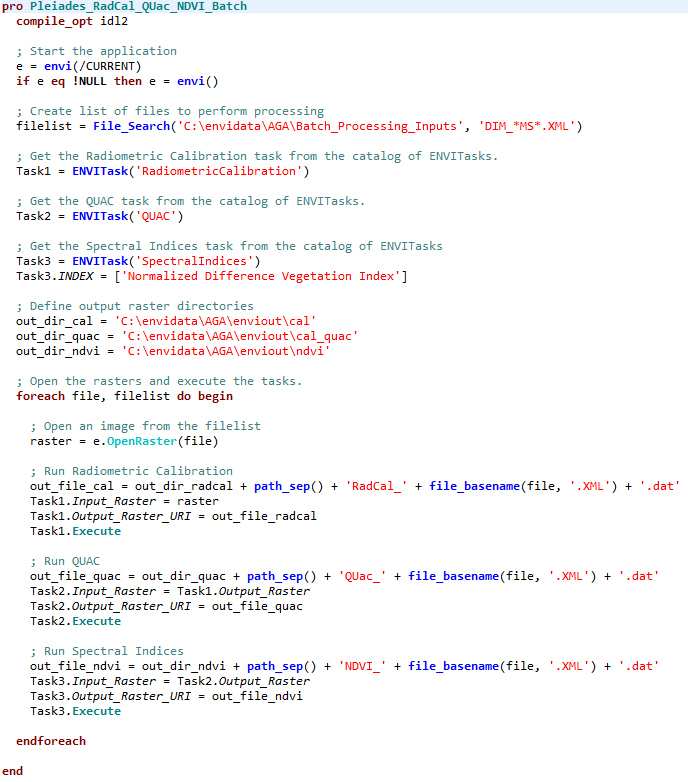
While coding in the ENVI API might not be for everyone, there are some serious advantages to digging in and becoming familiar with the ENVITask system. In the example shown above, we were able to perform radiometric calibration, atmospheric correction, and create an output NDVI image for 9 Pleiades 1A and 1B images simply by clicking "Go". I could go on and on about some of the exciting details of the ENVITask system, but in the interest of time I am going to move along.
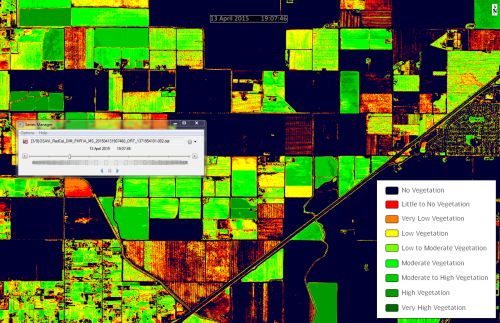
Next on my list is the ability to build a series of images (called a raster series) for spatiotemporal analysis, then view the images incrementally. In the image below, a raster series has been created from the results of running an Optimized Soil Adjusted Vegetation Index (OSAVI) on the 9 images provided by Airbus Defense and Space. Using the Series Manager, we can quickly step forwards or backwards through our series of images to get an idea of vegetation health for any given pixel in our scene throughout time. You can also quickly annotate the date and time of acquisition for your scenes and export your time series to video. In the example below, I have chosen to create a raster series from the results of image processing, but we could have just as easily created a time series from our original images.
The images that comprise a spatiotemporal series do not necessarily have to be in the same map projection or have the same spatial extent. An example is animating a time series to track a hurricane; in this case, it is not critical that the images have the exact spatial extent, projection, or resolution. However, ensuring a common projection and spatial extent allows you to perform a true multitemporal analysis; for example, studying the change in vegetation over time or the change in a glacier's extent over time in a specific location. To this end, ENVI has introduced several tools for gridding a raster series to a common projection and spatial extent. These Regrid Raster Series tools can be found in the ENVI Toolbox and can also be called programmatically via the ENVITask System.
The Regrid Raster series tools include the ability to regrid by the union of all images in the series, by the intersection of all images in the series, by the spatial extent and coordinate system of a selected image in the series, or by defining a custom grid (i.e. coordinate system, spatial extent, pixel size, etc...). These are powerful tools when you consider how much work would have been required in the past to make sure that each pixel in an image lines up exactly with each pixel in a set of corresponding images. Learn more about Spatiotemporal Analysis.
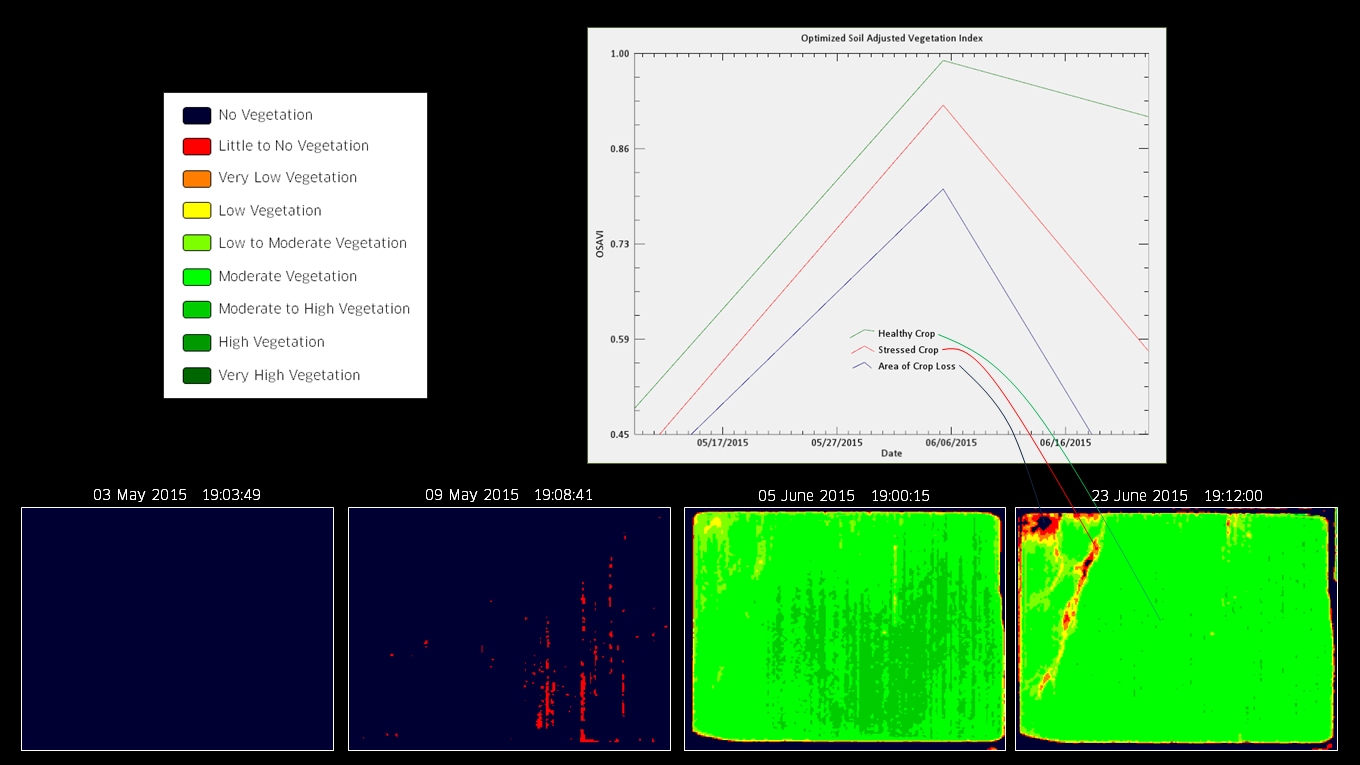
Last, but certainly not least, I want to talk a bit about the new Series Profile tool in ENVI. Once a raster series has been regridded to a common coordinate system and spatial extent, we can use the Series Profile tool to truly dig into a scene to get an understanding of how any given pixel has changed over time. In the example below, we are using our Pleiades image processing results to look at an individual field throughout the growing season. Using our Series Profile tool to view an Optimized Soil Adjusted Vegetation Index, we see that crop health steadily increased until sometime in the middle of June. By June 23, crop health began to decline and we even see signs of crop loss in the northwest corner of the field. This is just one example of how ENVI multitemporal analysis tools can provide insight into conditions that might not be readily available from the ground.