Gum Drop Plot
Anonym
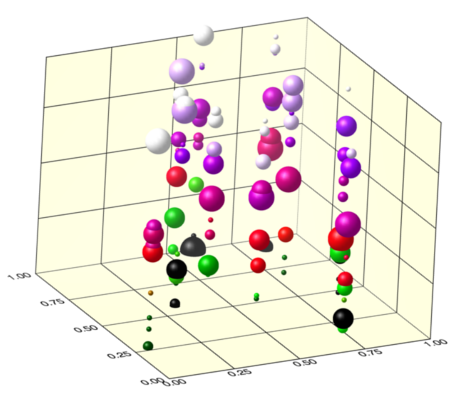
On our IDL page, there is an image that displays a plot made out of a series of colorful spheres. Based on my research, this plot was generated a long time ago most likely using IDL Object Graphics.
I wanted to generate a similar plot using the IDL 8 Graphics Functions. To do this, I used the SCATTERPLOT3D routine, the ORB object (provided with the IDL distribution but not documented), and the POLYLINE routine. An example of the output is shown below:

The data used to produce this plot is randomly generated. Therefore, if you run the code, the output will look different each time. The code used to generate this plot is shown below:
pro gum_drop
compile_opt idl2
;Generate some random data to
;plot
x = RANDOMU(seed, 10)
y = RANDOMU(seed, 10)
z = RANDOMU(seed, 10)
;Draw an initail scatter
;plot with symbolsize of 1
scat_plot = scatterplot3d(x,y,z,RGB_TABLE=2, $
SYM_OBJECT=orb(),$ ;use an orb object as symbol
SYM_SIZE=1, $ ;Set symbol size to 1
MAGNITUDE=z, $ ;change color with Z value
/SYM_FILLED, clip=0,$ ;Fill symbols and no clipping
xticklen=0, yticklen=0, zticklen=0, $ ;remove ticks
xsubticklen=0, ysubticklen=0, zsubticklen=0, $ ;remove ticks
xmajor=5, ymajor=5, $ ;Only use 5 ticks on each axis
xrange=[0,1], yrange=[0,1],$ ;force the x and y range
ASPECT_RATIO=1.0,$ ;Don't distort the image
DEPTH_CUE=[0,4], $ ;Make things farther away fade
AXIS_STYLE=2, $ ;Make the axis a box
background_color = 'light yellow')
;Draw 9 more plots where the symbol size
;changes each plot
for ind = 2L, 10 do begin
z = RANDOMU(seed, 10)
scat_plot_loop = scatterplot3d(x,y,z,$
RGB_TABLE=2, SYM_OBJECT=orb(),SYM_SIZE=ind/2, $
MAGNITUDE=z, /SYM_FILLED, clip=0, /OVERPLOT)
endfor
;Generate polygons to create a grid
;on the Z-Y and Z-X planes
x = [0.25,0.25,0.5,0.5,0.75,0.75]
y = [0.999,0.999,0.999,0.999,0.999,0.999]
z = [0.00,1.00,0.0,1.0,0.00,1.00]
;Connect every 2 points in polygon data
;with lines using the CONNECTIVITY keyword
con = [2,0,1,2,2,3,2,4,5]
poly0 = polyline(x,y,z,/DATA,CONNECTIVITY=con)
temp = x
x=y
y=temp
poly1 = polyline(x,y,z,/DATA,CONNECTIVITY=con)
temp = z
z = y
y = temp
poly2 = polyline(x,y,z,/DATA,CONNECTIVITY=con)
temp = x
x=y
y=temp
poly3 = polyline(x,y,z,/DATA,CONNECTIVITY=con)
;Remove the axis from the front of
;the plot
ax = scat_plot.AXES
ax[2].hide=1
ax[6].hide=1
ax[7].hide=1
ax[3].ticklen=1.0
ax[1].ticklen=1.0
end