Automated Cloud and Cloud Shadow Detection
Anonym
One of the most exciting new features in the upcoming ENVI 5.3 Service Pack 1 release is an implementation of the popular Fmask (Function of mask) algorithm that provides automated cloud and cloud shadow detection in multispectral images. The initial focus of the ENVI implementation is on the generation of a cloud mask raster that can be used in subsequent image processing analysis to mask-out all cloud+shadow pixels. Furthermore, the ability to invert the mask in tools such as the Classification Workflow will allow users who are actually interested in analyzing the clouds to mask-out all non-cloud pixels.
The Fmask (3.2) algorithm will be exposed in both a new "Calculate Cloud Mask Using Fmask Algorithm" desktop application tool and associated "ENVICalculateCloudMaskUsingFmaskTask" routine in the programmatic API. Both the GUI tool and API task will create a cloud mask for Landsat 4-5 TM, Landsat 7 ETM+, Landsat 8 OLI/TIRS and NPP VIIRS M-Band datasets (we plan to expand support to include Sentinel-2 in a future release). This tool/task requires the following inputs:
- An image containing multispectral bands calibrated to top-of-atmosphere (TOA) reflectance
- A thermal-band image calibrated to brightness temperatures (in Kelvins)
- A cirrus-band image calibrated to TOA reflectance (applicable to Landsat 8 only)
Here is an example input Landsat 7 ETM+ scene with what I call
popcorn clouds that has been calibrated to top-of-atmosphere (TOA) reflectance using the "Radiometric Calibration" tool in ENVI:
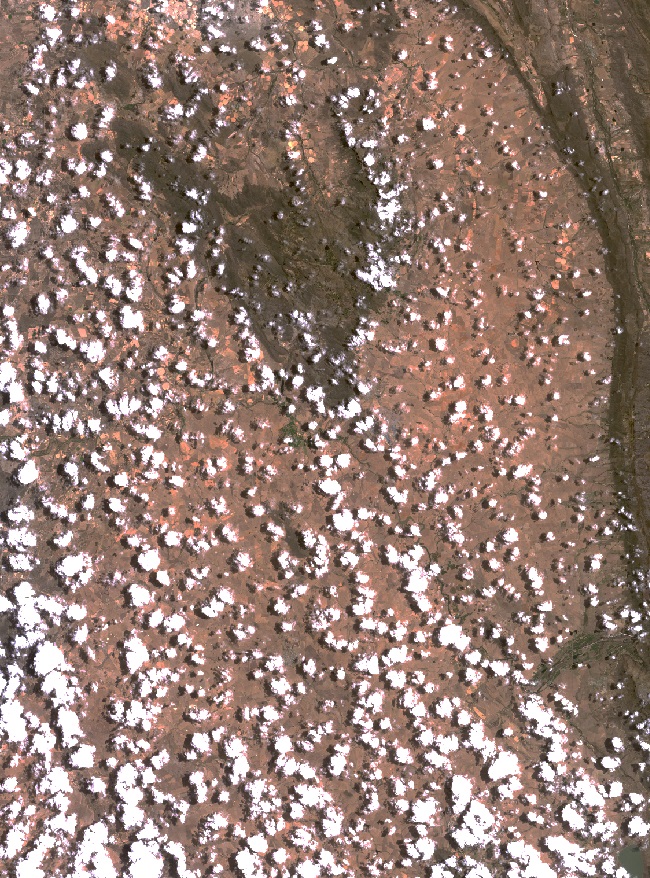
Image data downloaded from USGS EarthExplorer
Here is the output mask raster generated by the new "Calculate Cloud Mask Using Fmask Algorithm" tool with the cloud pixels displayed with a Cyan color (by default Masked pixels in a Mask raster are displayed Black but this color can be changed by the user):
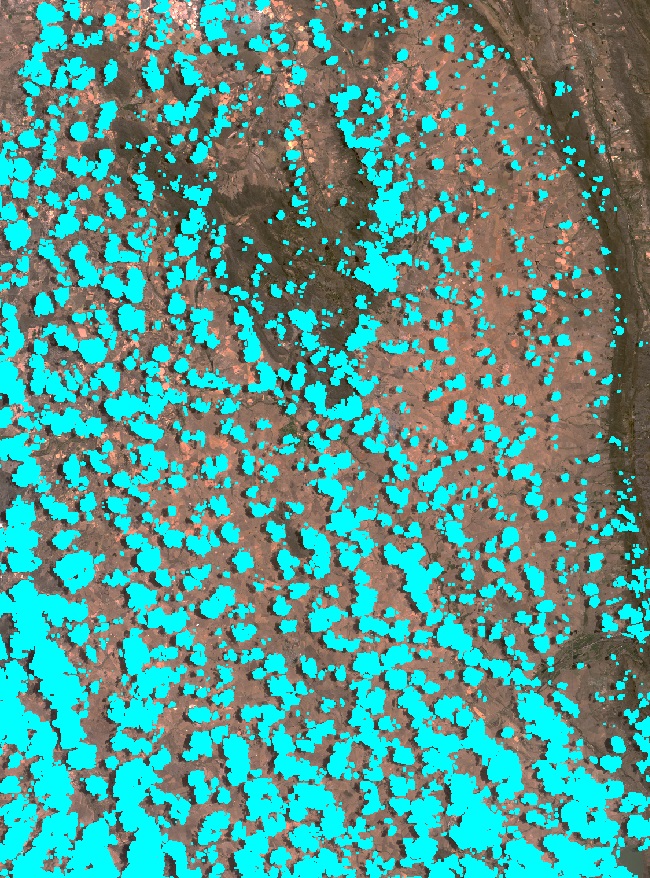
Image data downloaded from USGS EarthExplorer
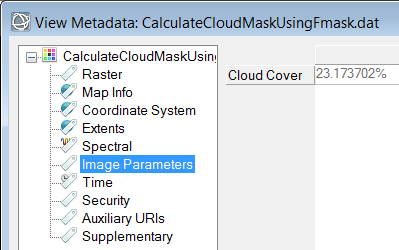
It is also worth mentioning that output mask raster will have the calculated scene cloud cover percentage captured in the new 'cloud cover' metadata that can be viewed in the View Metadata dialog:
The output mask raster can then be used as a mask in a subsequent land use/cover classification so that the cloud+shadow pixels do not impact the image processing. In the resulting classification image the cloud+shadow pixels will be designated into a "Masked Pixels" class displayed as dark gray (RGB=64,64,64):
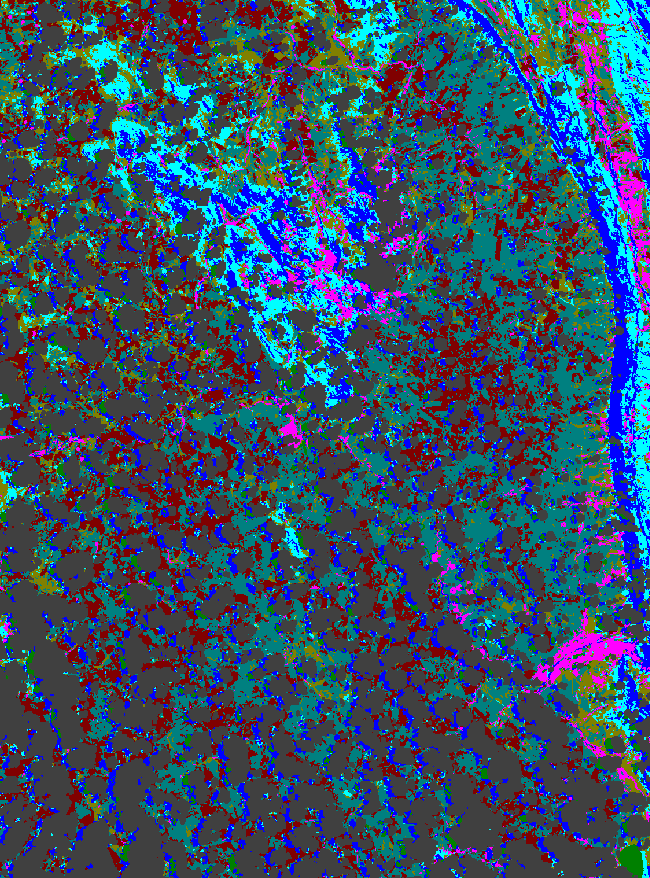
Image data downloaded from USGS EarthExplorer
Here is another example using a mosaic of two NPP VIIRS moderate resolution M-Band scenes from 23 Oct 2015 when Hurricane Patricia was making landfall on the coast of Mexico:
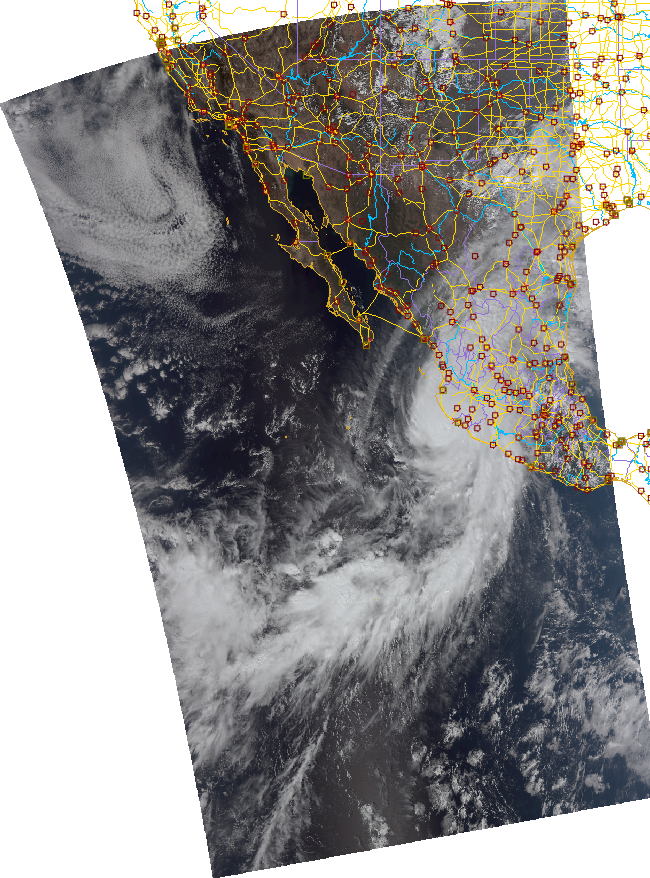
Image data downloaded from NOAA CLASS
Although the Classification Workflow has a convenient "Inverse Mask" option checkbox there are situations where it can be beneficial to invert the mask raster and save into a new file-on-disk that can be used independently. It just so happens that you can use the Band Math tool with clever expressions that involve binary operators like "B1 LT 1" in order to invert the values of a binary mask raster. In this case mask inversion results in the cloud pixels being "Not Masked" (i.e. On and displayed as White):
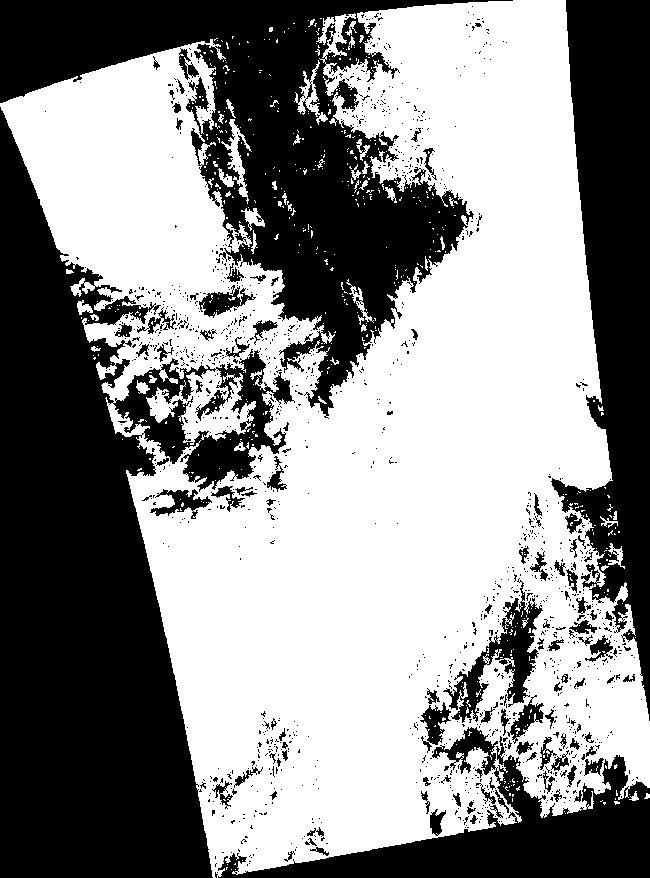
Image data downloaded from NOAA CLASS
A subsequent unsupervised classification of the NPP VIIRS M-Band data using this mask will actually result in a classification image of the clouds:
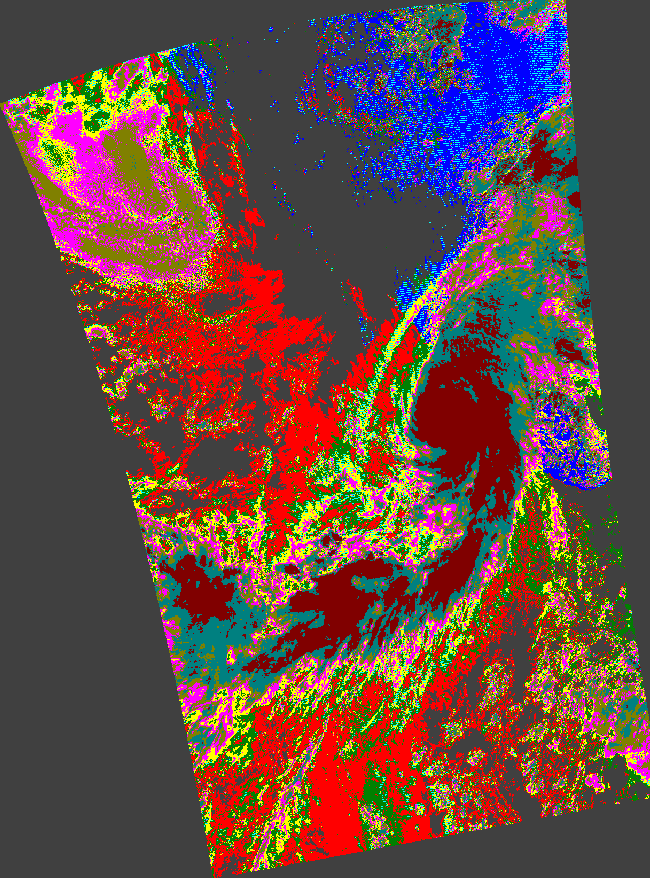
Image data downloaded from NOAA CLASS
CREDIT
The ENVI software uses the Fmask algorithm cited in the following references:
Zhu, Z., S. Wang, and C. E. Woodcock. "Improvement and Expansion of the Fmask Algorithm: Cloud, Cloud Shadow, and Snow Detection for Landsats 4-7, 8, and Sentinel 2 Images." Remote Sensing of Environment 159 (2015): 269-277, doi:10.1016/j.rse.2014.12.014 (paper for Fmask version 3.2).
Zhu, Z., and C. E. Woodcock. "Object-Based Cloud and Cloud Shadow Detection in Landsat Imagery." Remote Sensing of Environment 118 (2012): 83-94, doi:10.1016/j.rse.2011.10.028 (paper for Fmask version 1.6).