Color Image Display Using Bands From Different Datasets
Anonym
One of the more powerful new features introduced in the recent ENVI 5.3 Service Pack 1 release is the ability to display a color RGB raster layer (i.e. image) using bands from different raster datasets. This style of color image visualization is useful in a wide variety of scenarios including the ability to display multiple derived raster products together or create a composite image of data from different times (i.e. temporal analysis). This functionality was actually available using the Available Bands List within the ENVI Classic application but as of the latest service pack release users can create the same raster visualization in the new ENVI application.
In previous versions of ENVI (5.3 and older) if you tried to create a color RGB raster layer using bands from different datasets you would have seen the following warning message:
The selected bands are from multiple files.
Creating a layer from multiple files is not supported.
Now in ENVI 5.3 SP1 moving forward you can select bands from any raster dataset as you choose what to load into the Red | Green | Blue channels of an image display within the Data Manager dialog, for example:
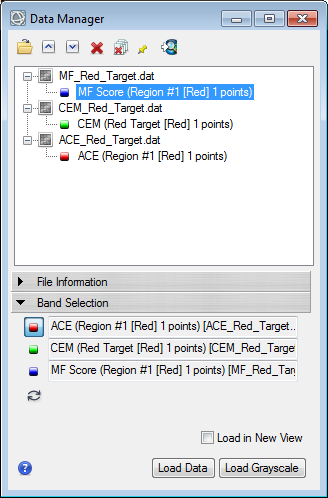
The steps to follow to create a new RGB layer consisting of three bands from different files are described in greater detail within the "Manage Raster Layers" topic of the ENVI software documentation help system. The same restrictions apply as before where the image bands must all have the same spatial size in terms of number of pixels in the X and Y dimensions ("Columns x Rows" or "Samples x Lines" depending on your preferred terminology) in order to display together as a single RGB color image. In most scenarios it also helps if the raster datasets are coregistered with the same geospatial extent and pixel size but this actually is not a requirement enforced by the ENVI software.
It is important to note that this capability only creates a raster layer visualization for on-screen image display within the ENVI software. If you wish to create a new file-on-disk dataset that is a coregistered stack of multiple input rasters there are tools in the ENVI Toolbox (and concomitant programmatic API routines) including the Image Registration workflow and Layer Stacking tool that provide this functionality.
For the purpose of this blog post I want to illustrate a simple example where the results of three different processing tools used in a target detection scenario can be displayed as a single RGB color image. In this scenario I utilized some of the ProSpecTIR-VS hyperspectral data acquired over Avon, NY as part of the RIT SHARE 2012 project. For the target detection training data I used a spectrally pure endmember pixel from one of the bright red targets present within this HSI scene:
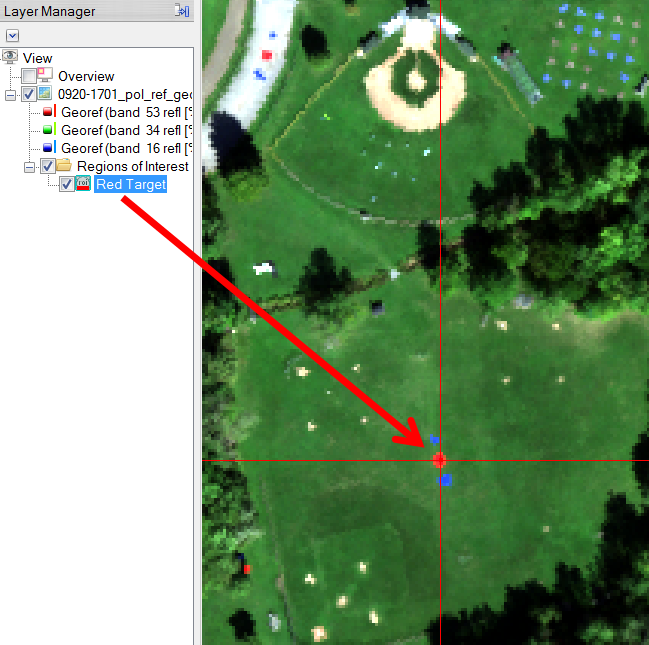
Hyperspectral image data provided courtesy of Rochester Institute of Technology
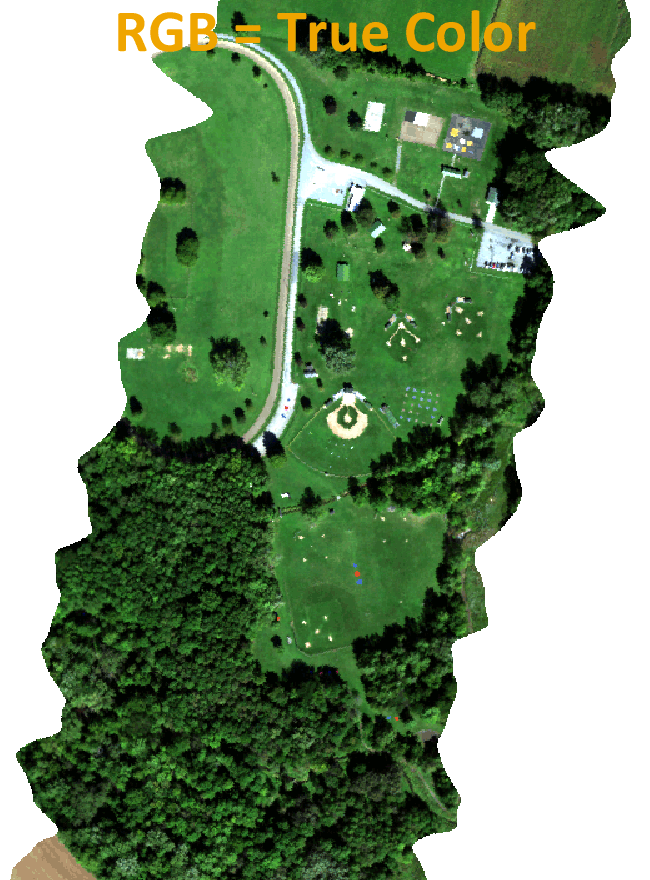
In the image animation below you will see the True Color image followed by a RGB composite image comprised of the processing results from three different spectral mapping algorithms:
R = Adaptive Coherence Estimator (ACE)
G = Constrained Energy Minimization (CEM)
B = Matched Filtering (MF)
In the RGB composite image display the pixels that have the highest value match to the input target in each of the three different spectral mapping algorithms will end up being pure white. Consequently, if you keep your eye on the bright red pixels from the input hyperspectral image you will notice they are "bright" in the RGB composite image comprised of results from the target detection algorithms. What is interesting to notice is how the red targets in shadow next to the trees at the southern end of the open field have a distinct magenta appearance which suggests that the ACE and MF algorithms did the best job identifying these targets (i.e. red + blue = magenta). Furthermore, one of the other bright targets in the parking lot toward the top of this scene has a bright green appearance in the RGB composite image suggesting that the CEM algorithm identified this region as a match which is probably a false positive in this target detection scenario.
Hyperspectral image data provided courtesy of Rochester Institute of Technology