Examining Changes to Surface Water in Reservoirs Located Along the Western Flank of the Sierra Nevada, California
Anonym
For this blog post I will be performing a quick case study to show how some of the new features in ENVI 5.2 make visualizing and extracting information from remotely-sensed data easier than ever. We will be examining changes to surface water in reservoirs along the western flank of the Sierra Nevada region of California. This region is currently in the third year of one of its worst droughts in the past century.
Landsat imagery for the region has been obtained for September 1999, September 2004, September 2009, and September 2014. The Landsat program is a joint initiative between the United States Geological Survey and NASA, which has been continuously collecting moderate resolution imagery of the Earth's surface since the early 1970s.
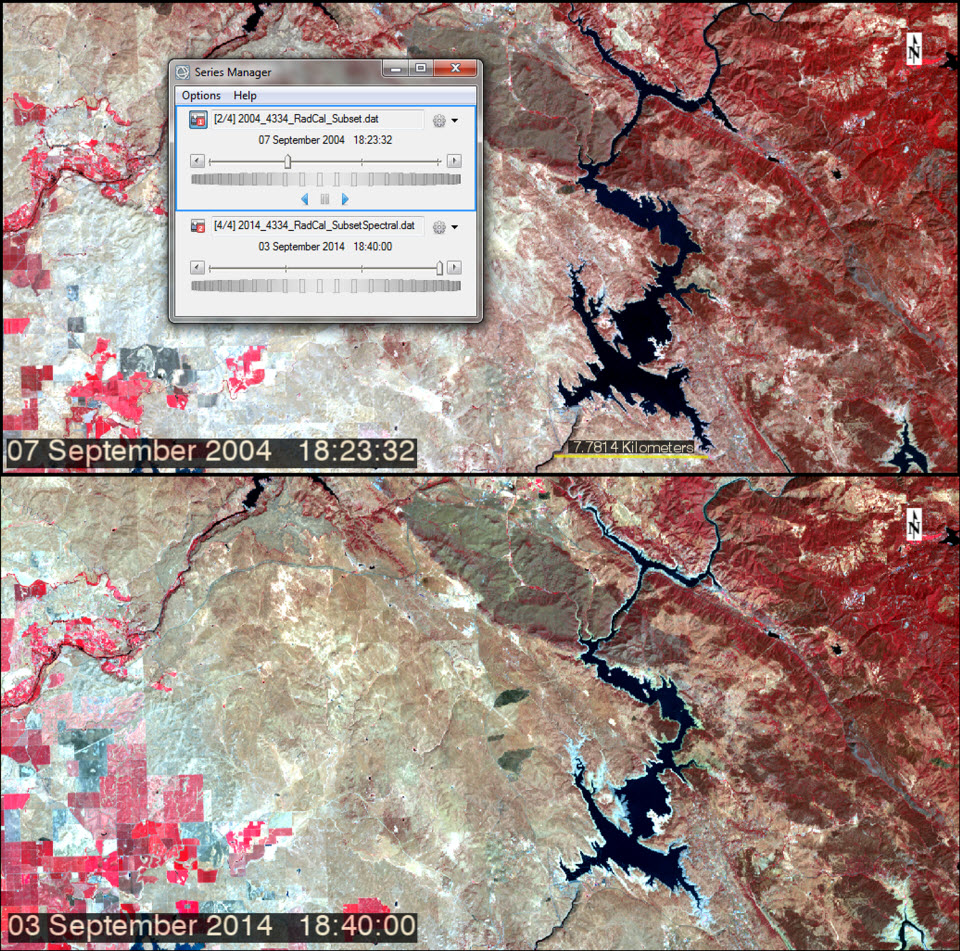
We will begin our case study by using the new Spatiotemporal Analysis tools available in ENVI 5.2 to quickly step through the images of our scene to view the changes that have occurred throughout time. The Spatiotemporal Analysis tools allow users to step forward and backward through a series of images and also allow for quick annotation of such information as a scene's time and date of acquisition. An animation of your time series can also be exported to many common video formats. Using the Spatiotemporal Analysis tools we can begin to get an idea of how water levels in the reservoirs depicted in our scene have changed throughout the time period represented by our images.
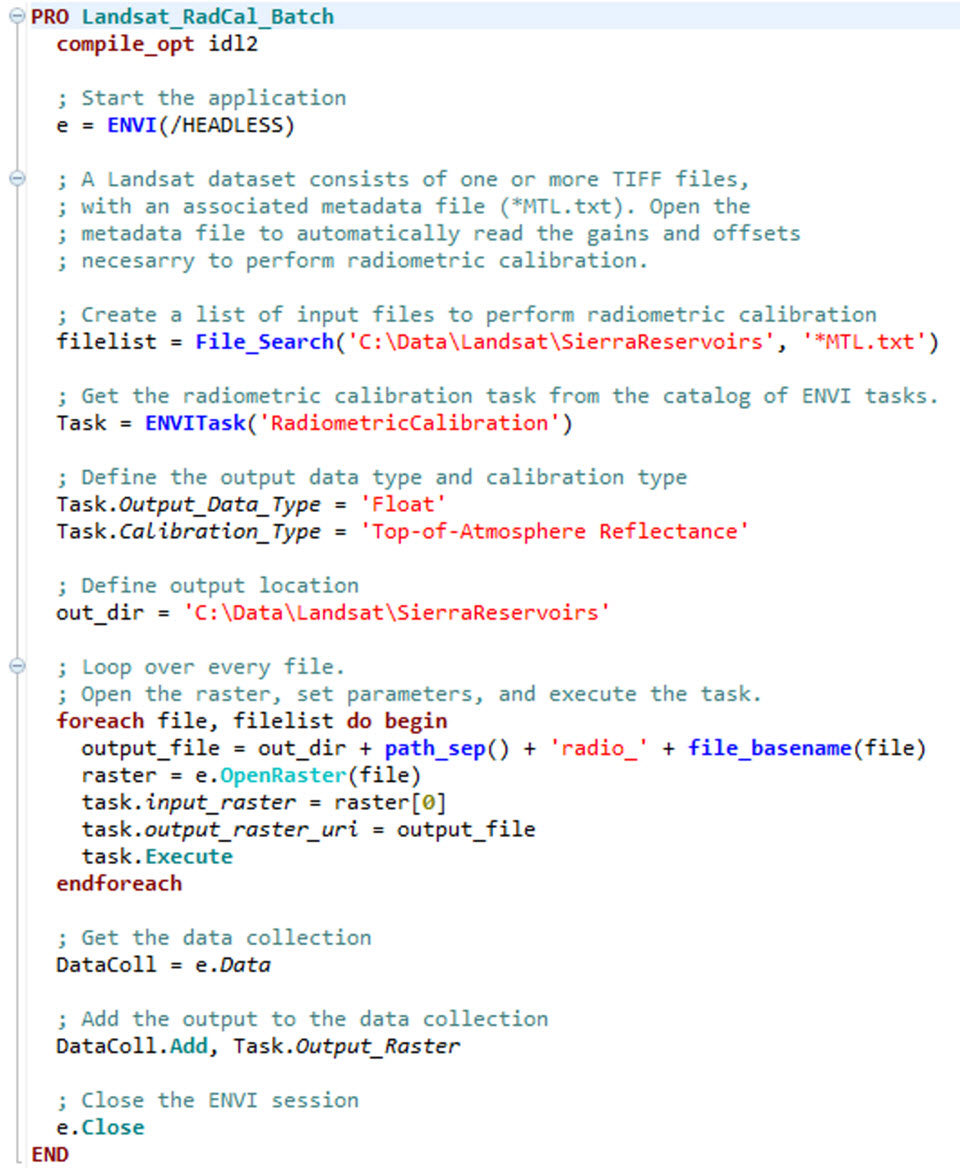
In ENVI 5.2 we have introduced something called an ENVITask, which simplifies and speeds up the pre-processing and analysis of imagery. ENVITasks are multi-threaded, which means that ENVI will take full advantage of working on a machine with multiple cores. ENVITasks are accessible in the ENVI Toolbox or they can be run as batch processes through the ENVI API. The nice thing about ENVITasks is that they all follow a very simple and standardized format, so once you get the hang of working with an ENVITask you can easily repeat these steps with other ENVITasks or chain multiple ENVITasks together to run all at once. ENVITasks are also available out-of-the-box with the ENVI Services Engine, which allows for use of these algorithms in an enterprise or web-based environment. For this case study, ENVITasks were used to radiometrically calibrate, atmospherically correct, and apply a spectral index to the scenes. The ENVITask I wrote to perform Radiometric Calibration on the Landsat images is shown below. This code is very straight forward and is mostly taken directly from the documentation of this ENVITask. With this now written, I can simply change a couple of lines of the code which point to my input and output directories in order to run it on any other imagery I might work with in the future. Pretty cool, right?
ENVI 5.2 provides the ability to compute up to 64 common spectral indices. The spectral index applied to these images is optimized for isolating water from multispectral imagery. The result is a grayscale image in which brighter pixels correspond to higher water content.
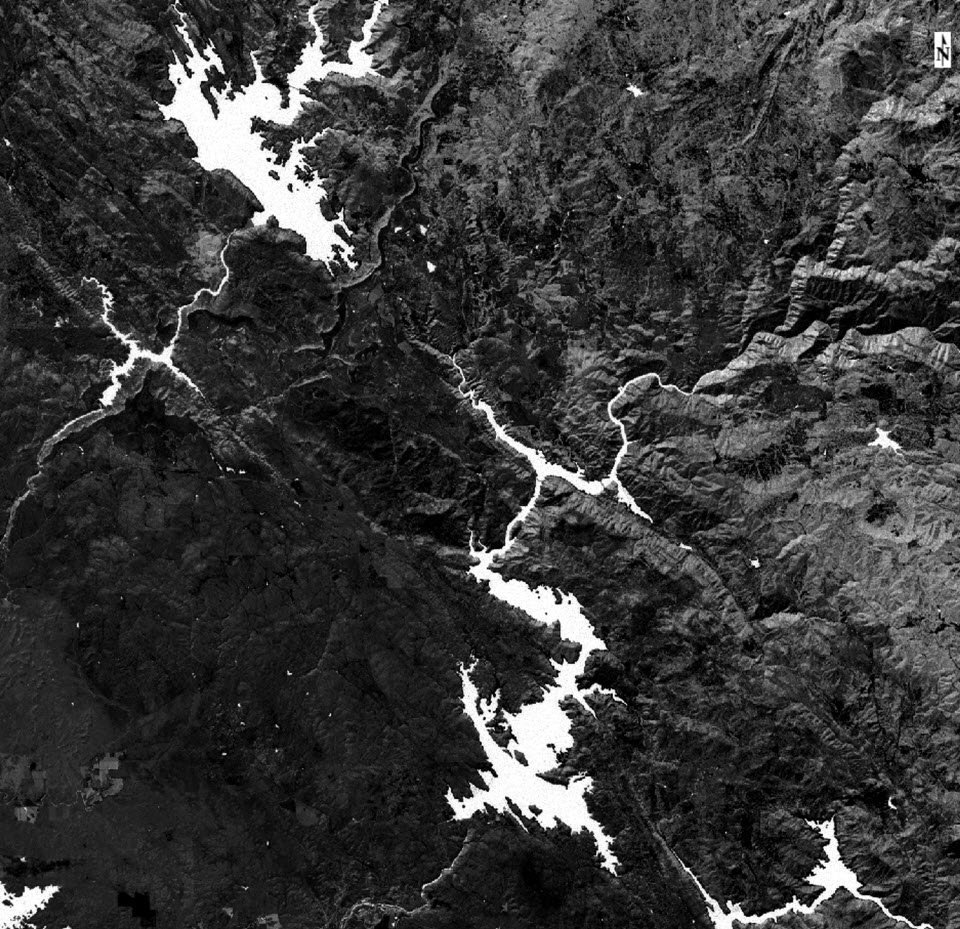
Now that we have the information we are interested in isolated in our images, we can use the Raster Color Slice tool in ENVI to threshold our water index images to extract our water features. The Raster Color Slice tool allows users to dynamically "slice" an image into different segments based on the range of pixel values desired. So, we can use the Raster Color Slice tool to quickly find the brightest pixels in our water index images which represent water. Raster Color Slices can be exported as an ENVI classification image or to shapefile format.

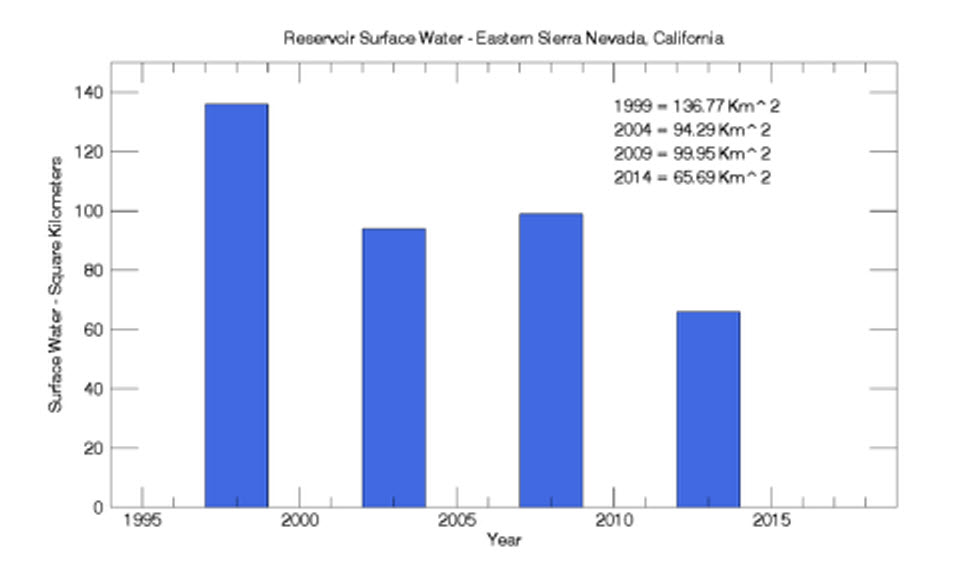
Now that we have the information we are looking for we can compare the amount of surface water across the scenes in our case study. Results show that in 1999, reservoir levels were at their highest level throughout the period observed. Following a drastic decrease between 1999 and 2004, water levels went up slightly between 2004 and 2009. In 2014, another drastic decrease in water levels was observed.This drastic drop in reservoir water levels is indicative of the major drought that is pervasive throughout the region. Using IDL we can quickly generate a bar plot to show the results of our findings. If you are interested in becoming more familiar with the tools that I presented in this case study, please check out this Tutorial, which examines urban growth in Las Vegas using Landsat imagery.