Generating an Ellipsoid using IDL 8 Graphics
Anonym
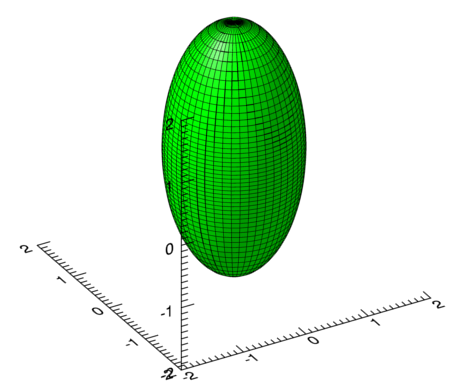
This blog post describes how you can use IDL to generate an ellipsoid such as the one shown below:
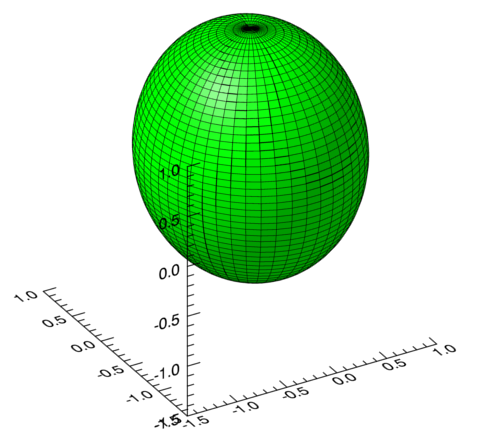
The MESH_OBJ, POLYGON, and PLOT3D routines were used to create this graphic, and the code that was used is shown at the bottom of the post (dj_ellipsoid_ng).
When using MESH_OBJ routine to create spherical object, you need to provide a two dimensional grid of radius values.The rows of this grid correspond to the longitude which goes from 0 to 360 degrees (theta). The columns of this grid correspond to the latitude which goes from -90 to 90 degrees (phi).
Since, MESH_OBJ requires the grid of radius values, and the value of the radius depends on the latitude and longitude, you must first generate latitude and longitude grids. To generate the longitude grid (theta), I first generated a 51 element array going from 0 to 360 and converted to radians (to be used with the COS and SIN routines):
theta_1d = (findgen(51)*360/50)*!dtor
Then, I used a combination of the CONGRID and TRANSPOSE routines to replicate the values from theta_1d into a 51 by 51 element array. The first TRANSPOSE call “theta_1d” makes the CONGRID routine accept it as a 2D array.
theta = congrid(transpose(theta_1d),51,51)
theta = reform(transpose(theta))
I created the latitude grid (phi), using the same method:
phi_1d = ((findgen(51)-25)*180/50)*!DTOR
phi = congrid(TRANSPOSE(phi_1d),51,51)
The next step is to determine the radius value for each longitude and latitude function. To calculate the radius, I used the equation for an ellipsoid shown below:
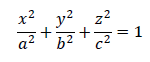
I converted this equation to spherical coordinates, and then solved it for “r”:
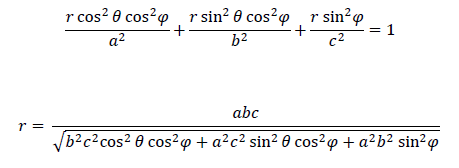
Using this result, I wrote the function “dj_get_rad”, which accepts the latitude and longitude grids and returns a grid of the radius values. I then used MESH_OBJ with the radius values returned from this function to get the vertices and polygons of the ellipsoid.
The final step is to create a visual of the data. To do this, I called PLOT3D with the NODATA keyword to generate the empty 3D dataspace. Then, I called POLYGON with the vertices argument set the vertices returned by MESH_OBJ and the CONNECTIVITY keyword set to the polygons returned it.
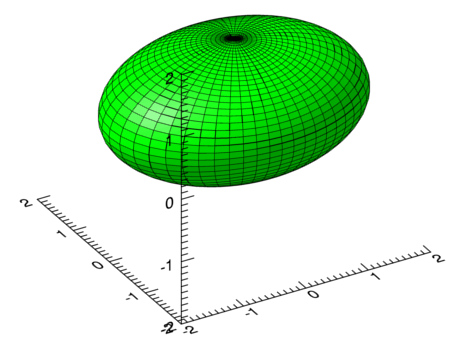
The "dj_ellispoid_ng" routine shows how this can be done. It requires 3 arguments which correspond to the "a", "b" and "c" parameters in the ellipsoid equation.Some sample images generated with different parameter values are shown below:
IDL> dj_ellipsoid_ng, 2,1.5,1 ;a=2,b=1.5,c=1
IDL> dj_ellipsoid_ng, 2,2,1

IDL> dj_ellipsoid_ng, 1,1,2
function dj_get_rad, theta, phi, a,b,c
compile_opt idl2
;use the formula for the ellipsoid to
;determine the radius for various values
;of theta and phi.
radius = sqrt(((a*b*c)^2)/( $
b^2*c^2*(cos(theta)^2)*(cos(phi)^2)+ $
a^2*c^2*(sin(theta)^2)*(cos(phi)^2)+ $
a^2*b^2*(sin(phi)^2)))
return, radius
end
pro dj_ellipsoid_ng, a, b, c, data=data
compile_opt idl2
;create a grid of theta values
;these are the longitude of the of the
;ellipsoid and go from 0 to 360 degrees
theta_1d = (findgen(51)*360/50)*!dtor
theta = congrid(transpose(theta_1d),51,51)
theta = reform(transpose(theta))
;create a grid of phi values. these
;are the latitude of the ellipsoid and go
;from -90 to 90 degrees
phi_1d = ((findgen(51)-25)*180/50)*!dtor
phi = congrid(transpose(phi_1d),51,51)
;use "get_rad" function to determine the
;radius values at each point of the theta
;and phi grid
radius = dj_get_rad(theta,phi,a,b,c)
;radius = get_rad(theta,phi,a,b,c)
;create a mesh using the radius values
;this ouputs the vertices (vert) and polygons
;that will be used to generate the plot
mesh_obj,4,vert,pol,radius
;output the data
if (arg_present(data)) then begin
data=vert
endif
;determin the biggest value and create a scale from it
m = max([a,b,c])
scale = (findgen(10)-5)*m/5
;plot the scale and axis with no data. set clip=0, to
;prevent edges of ellipsoid from getting cut off.
p_scale =plot3d(scale,scale,scale,/nodata,clip=0,$
aspect_z=1, aspect_ratio=1)
;use the polygon to plot the mesh. use the
;vertices and polygons output from the mesh_obj
;to fill out the data argument and connectivity keyword.
;use bright green as the color.
p = polygon(vert,connectivity=pol,/data,$
clip=0,fill_color=[0,255,0])
end
;main level program
;for some reason, if 'a; does
;not equal 'b', the ellipsiod
;comes out messed up
dj_ellipsoid_ng,1,1.1,1.2,data=out_vert
end