Spatial Data Reduction and Pixel Purity Index
The Spectral Hourglass Series: Part 4
Anonym
This blog continues our discussion on the Spectral Hourglass Workflow available within ENVI®.
After reducing the number of spectral bands our next step involves reducing the data spatially so that we only focus on pixels that are pure. We want our workflow to be as efficient as possible and ignoring pixels which do not contain pure endmembers will aide this effort. In order to accomplish this task, we can use ENVI to create a Pixel Purity Index (PPI) Image.
The Pixel Purity Image means this – each pixel value corresponds to the number of times that pixel was recorded as extreme and further, the general purpose of the PPI image is to associate spatial information (pixel locations) with the probability that each pixel represents a pure image endmember.
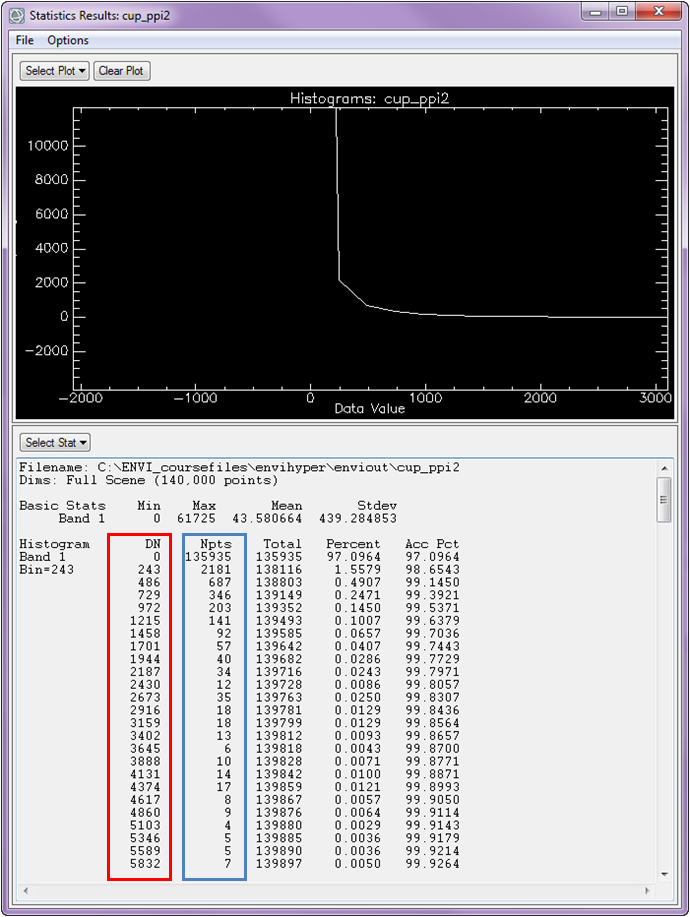
The ‘DN’ (outlined in the red box) that you see represents a specific pixel value, and the ‘Npts’ (blue box) values that you see represent the total number of times that specific pixel value was identified/found in the image. A high PPI value means it has been an endmember in more iterations.
The goal of this step is to identify pixel values that did not occur with extreme frequency, because the endmembers (pure pixels) will most likely only be represented by a few pixels. As is the nature of a typical hyperspectral scene you will have mainly mixed pixels, but there will be a small number of endmembers (pure pixels) that can be extracted to map their frequency in the image. Now, this is a general rule of thumb and will vary greatly depending on the quality of HSI data you receive, along with the general area where the data is collected from. For instance, if you are in a mineral rich area with large outcroppings of pure minerals, then you would most likely have a large frequency of endmembers as there is not much mixing of minerals in that region.
Choosing a threshold allows you to choose the point at which you deem something to truly be spectrally unique or not. The smaller the threshold value you choose the fewer pixels will be identified as being pure (i.e., pixels will have to be more pure in order to project onto the tail of the histogram).
An appropriate image threshold must be determined empirically. This requires some trial and error. From the histogram above, you can see that the PPI image has a minimum value of 0 (pixels that were never identified as pure) and a maximum value of 61725 (pixels that were identified 61725 times during the PPI iterations). You can select a starting point for the threshold value by selecting a value near the break in slope (maximum curvature) of the input histogram, and in our case this would be around 1000.
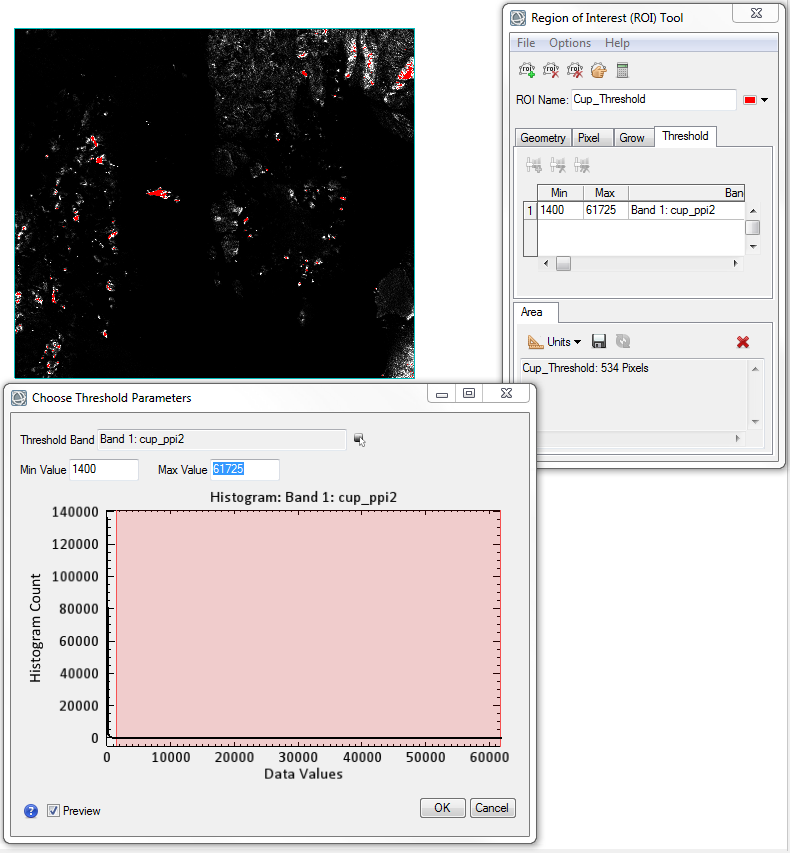
Using that value of 1000 we can apply a band threshold to the PPI image that will now only include pixels in the image with high pixel values and low frequency; in other words we will only be left with spectrally pure endmembers. Determining the exact PPI threshold value is made very easy with the new ROI Tool. When selecting a threshold the ENVI display window will dynamically update to colorize the pixels which contain the range of values stipulated in the Choose Threshold Parameters dialog window (the red pixels in the attached figure). The ROI Tool dialog also updates with area information to detail how many pixels are contained within this newly created ROI. Due to the nature of HSI data and pure endmembers we know that the total number of pixels contained in the ROI should be no more than a few hundred pixels. Using a threshold value of 1400 we will be left with only 534 pixels, a reasonable number in our case.
Once a threshold has been applied to the PPI image the next step will be to extract endmembers via the n-D Visualizer tool available in ENVI.
Read The Spectral Hourglass Series: Part 5, Working in n-Dimensional Space
Read The Spectral Hourglass Series: Part 3, Hyperspectral Data Reduction