The Difference Between Night And Day
A little processing goes a long way in using the VIIRS Day-Night Band
Anonym
One of the most interesting new capabilities of the NOAA/NASA/DoD Suomi-NPP satellite is the Day-Night Band. These detectors, part of the VisibleInfrared Imaging Radiometer Suite (VIIRS), are sensitive enough to image Earth’s surface by starlight. The Day-Night Band is both higher resolution and up to 250 times more sensitive than its ancestor, the DMSP Operational Linescan System (OLS).
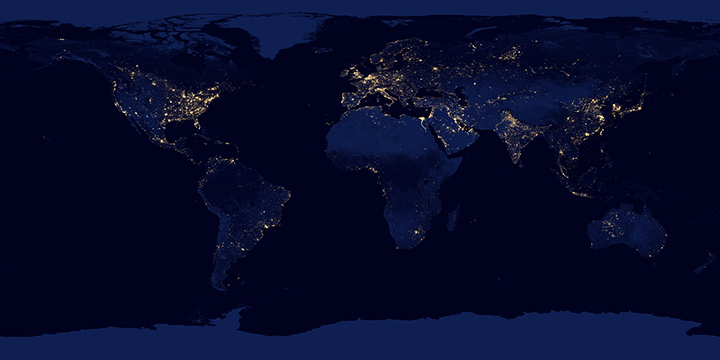
Applications of the Day Night Band include monitoring warm, low-level clouds, urban lights, gas flares, and wildfires. Long-term composites reveal global patterns of infrastructure development and energy use.
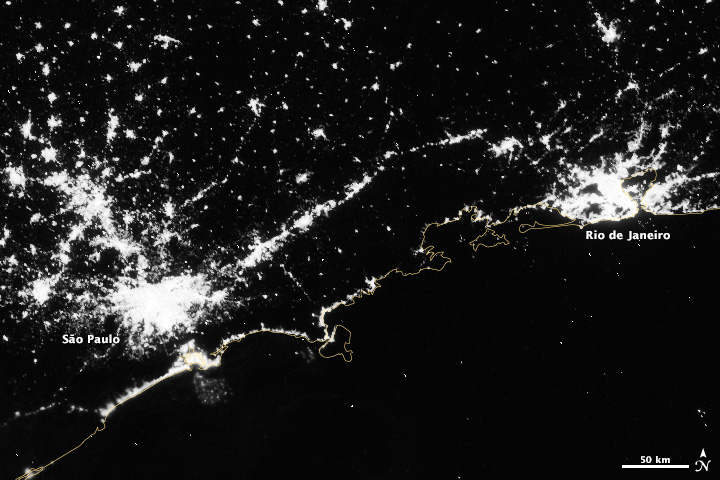
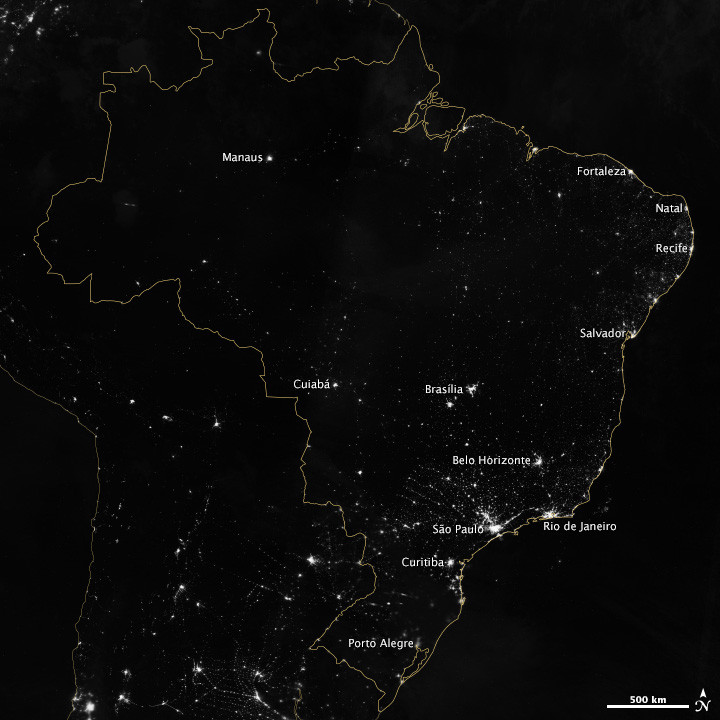
Over shorter times scales (Suomi-NPP completes an orbit every 100 minutes or so) multiple Day Night Band scenes stitched together show a snapshot of the Earth at night, like this view of South America, including the 14 Brazilian World Cup cities.
Marit Jentoft-Nilsen and I used a number of software tools to read, stitch, project, and visualize the data, starting with a handful of HDF5 files. VIIRS data is aggregated into granules, each acquired over 5 minutes. These files are distributed, archived, and distributed by NOAA’s CLASS (the Comprehensive Large Array-data Stewardship System). To deal with the unique projection of VIIRS, I used ENVI’s Reproject GLT with Bowtie Correction function to import the data. (If you’re unfamiliar with VIIRS data, now’s a good time to read the Beginner’s Guide to VIIRS Imagery Data (PDF) by Curtis Seaman of CIRA/Colorado State University.)
So far so good. Of course the data is in Watts per square meter per steradian, and the useful range is something around 0.0000000005 to 0.0000000500. With several orders of magnitude of valid data, any linear scale that maintained detail in cities left dim light sources and the surrounding landscape black. And any scaling that showed faint details left cities completely blown out.
To make the data more manageable, show detail in dark and bright areas, and allow export to Photoshop I did a quick band math calculation: UINT(SQRT((b1+1.5E-9)*4E15)*(SQRT((b1+1.5E-9)*4E15) lt 65535) + (SQRT((b1+1.5E-9)*4E15) ge 65535)*65535)
It looks a bit complicated, but it’s not too bad. It adds an offset to account for some spurious negative values; multiplies by a large constant to fit the data into the 65,536 values allowed in a 2-byte integer file; calculates the square root to improve contrast, sets any values above 65,535 to 65,535; then converts from floating point to unsigned integer. This data can be saved as a 16-bit TIFF readable by just about any image processing program, while maintaining more flexibility than an 8-bit file would.
The final steps were to bring the TIFF into Photoshop, tweak the contrast with levels and curves adjustments to bring out as much detail as possible, add coastlines and labels, and export for the web. The result: Brazil at Night published by the NASA Earth Observatory on the eve of the World Cup.