Update Your Vector Geodatabase with LiDAR
Anonym
I recently put ENVI LiDAR to the test by using it to extract a series of features from a LiDAR dataset and matching it up with some satellite imagery to see just how well it performed. The goal was to see just how well the polygons from the automatically extracted building footprints and trees would line up with what could be seen in the imagery. Below we can see a LiDAR collect over a portion of Longview, WA.
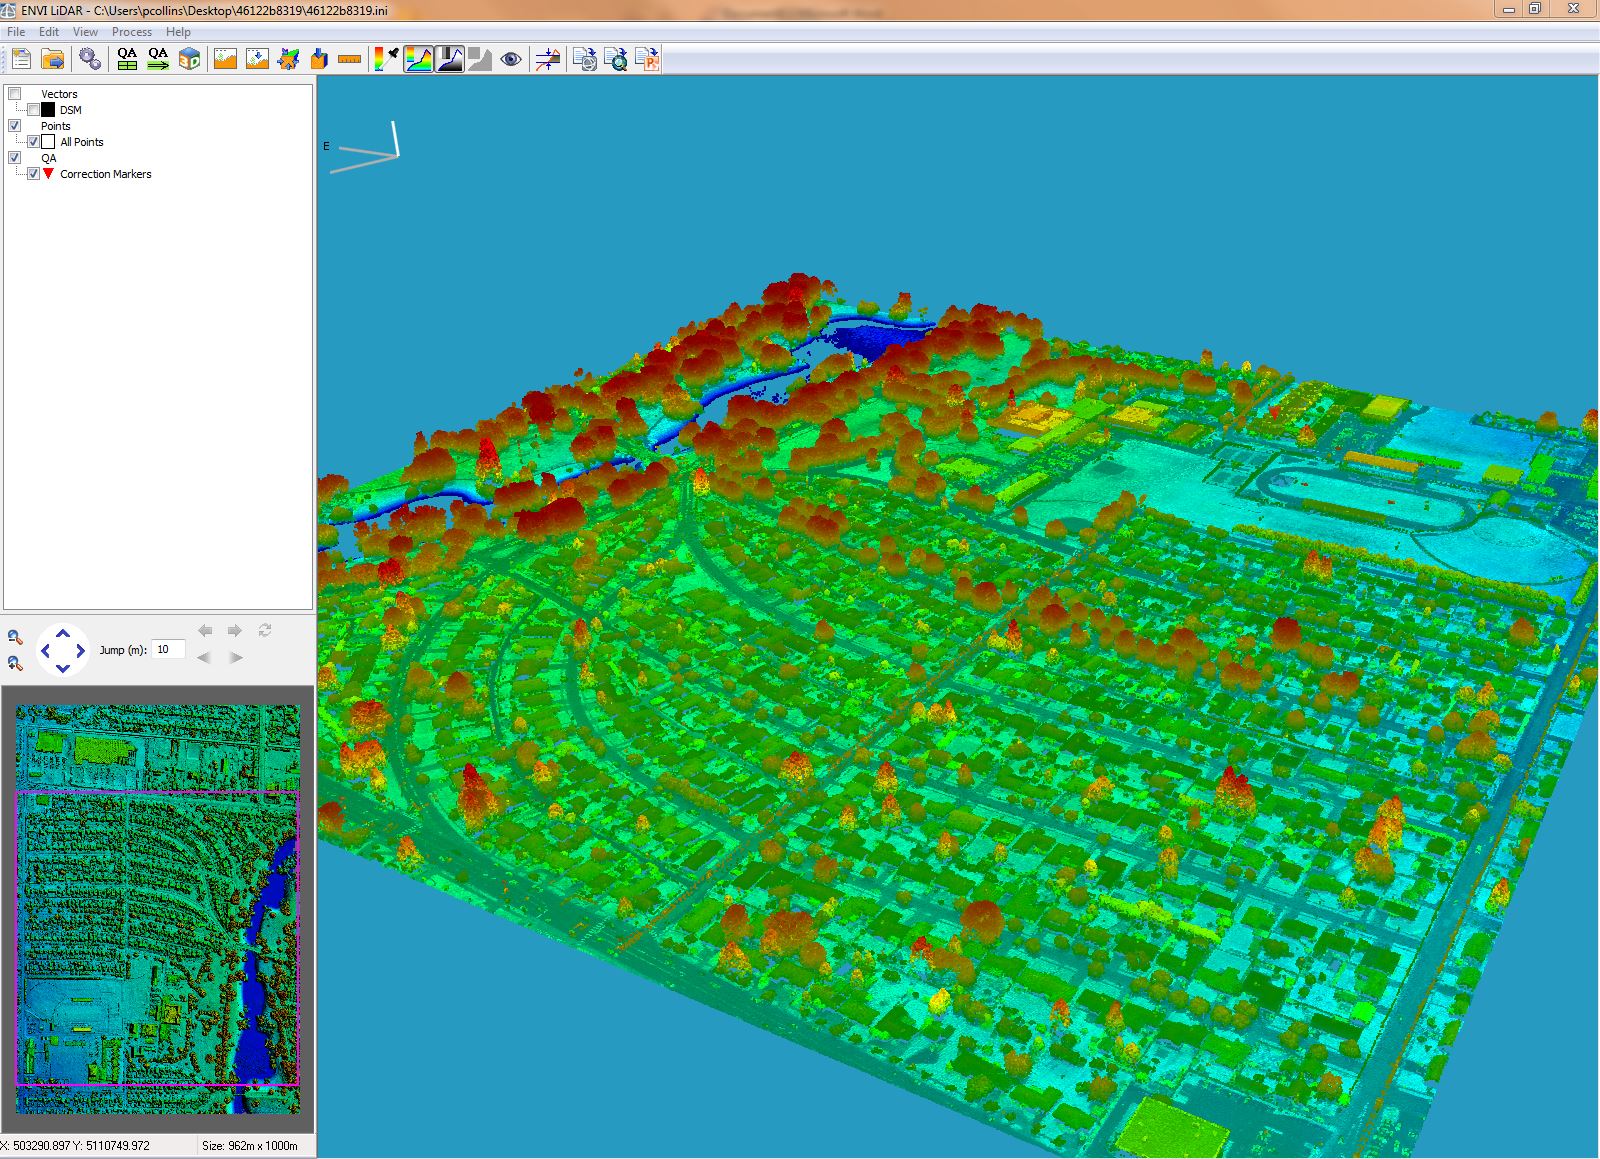
Data Courtesy of NOAA
After running the automatic Feature Extraction process in ENVI LiDAR, we are presented with the features in QA mode. This mode allows the user to interactively correct anomalies in the extracted features. QA mode allows you to fix roof vectors, tree size, and elevation, as well as reclassify points, and place buildings, trees, or power poles where you want to in the scene.
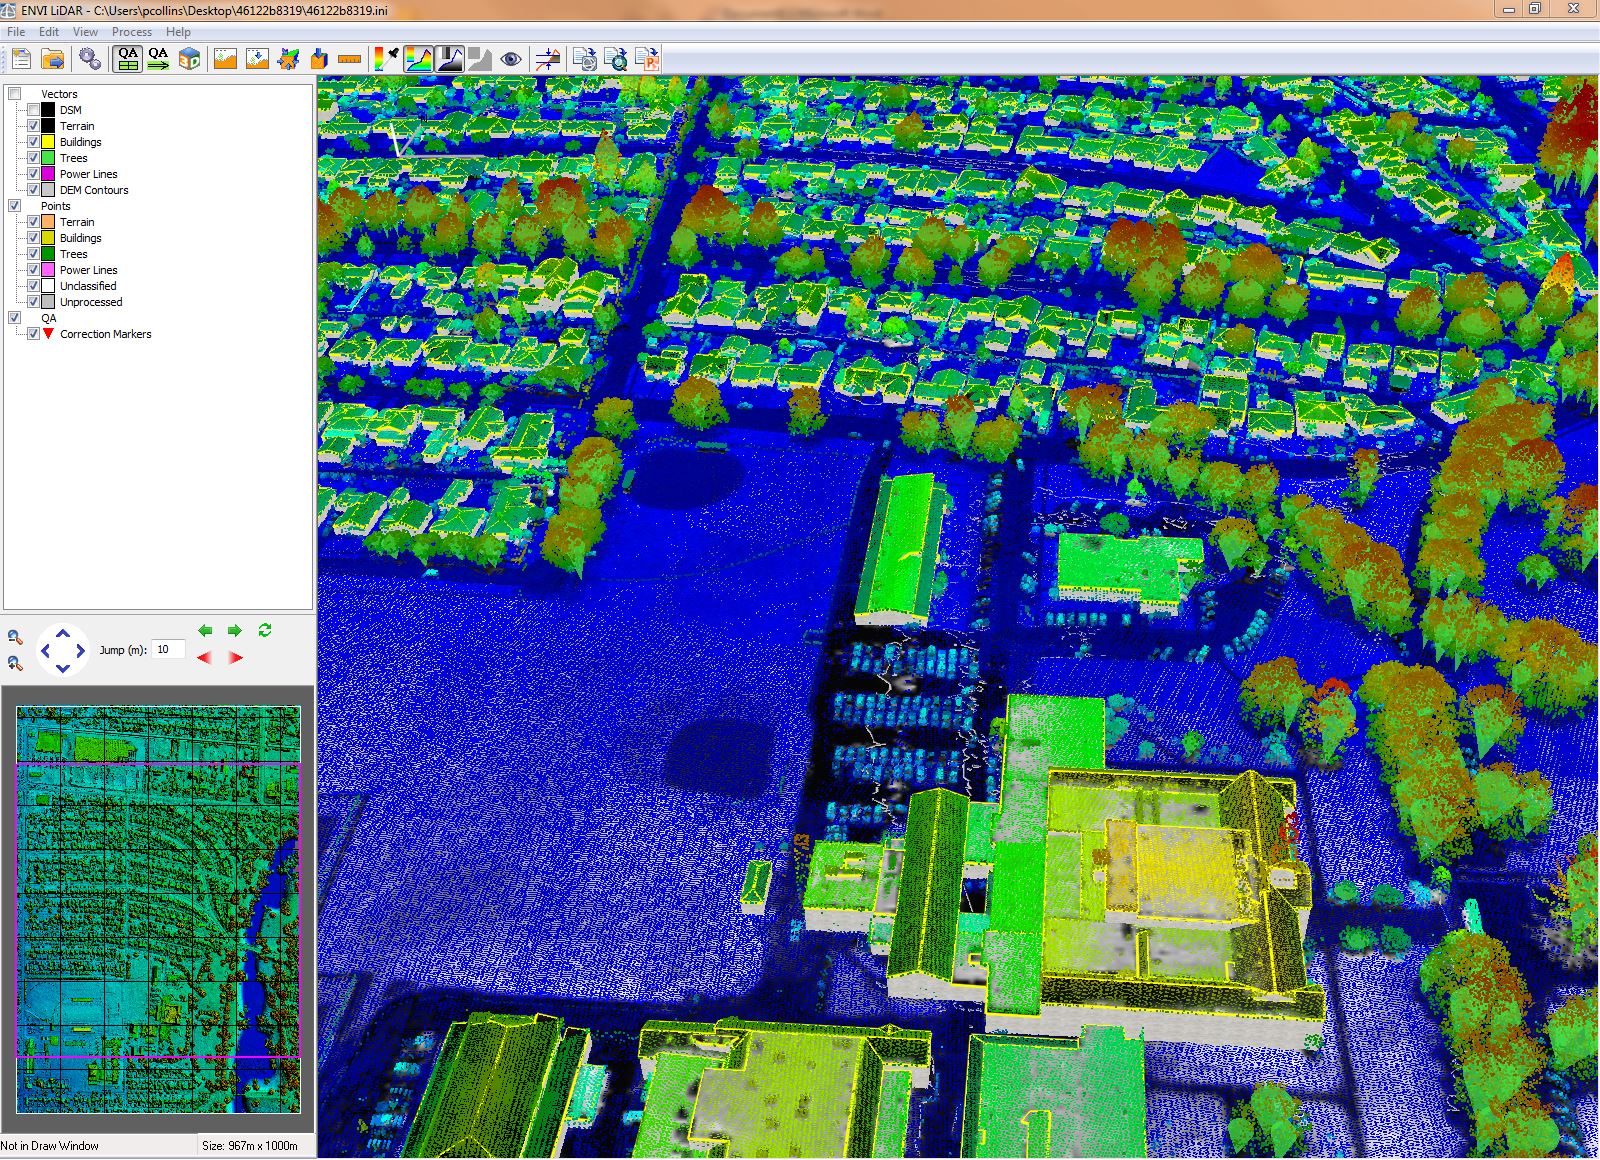
Data Courtesy of NOAA
Once the features have been corrected, it's a simple click to push all of this derived data over to an ArcGIS® instance for further analysis, and to build out your geodatabase. Here we see the buildings footprints, tree locations, and elevation model display in ArcGIS.
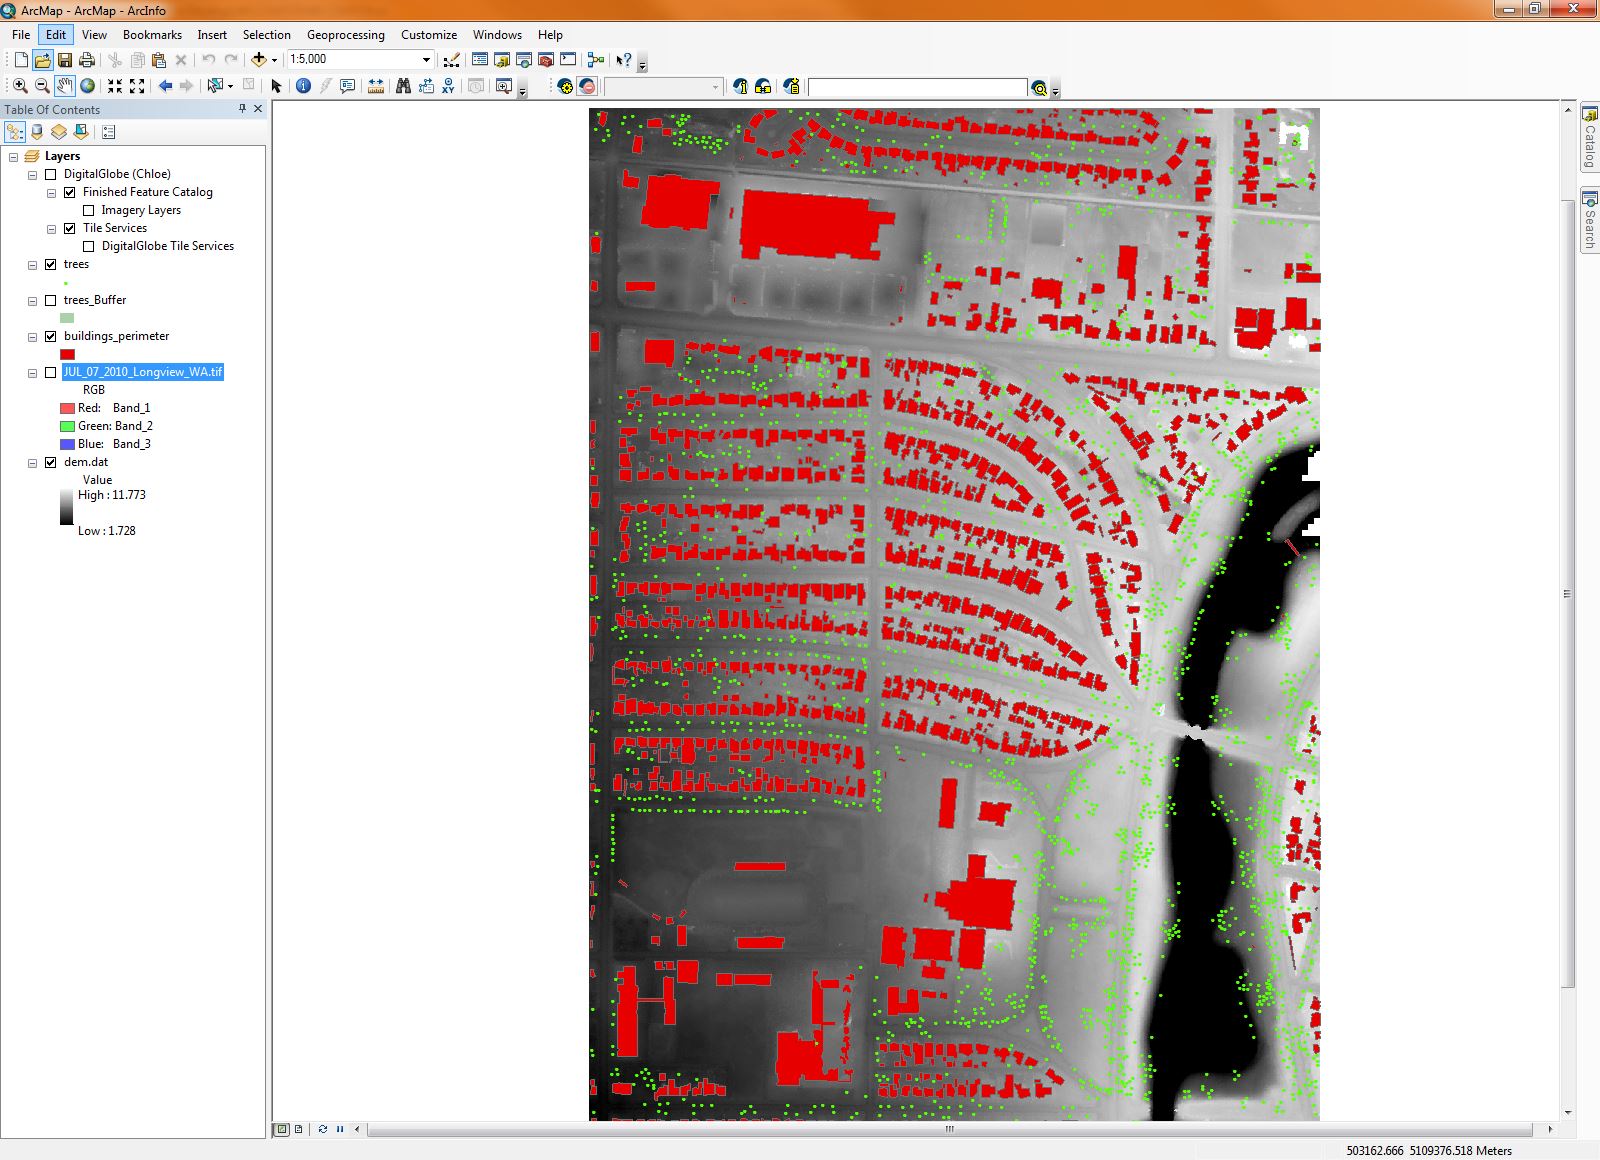
Data Courtesy of NOAA
The next step was to pull in some satellite imagery from the DigitalGlobe™ Global Basemap. The aerial imagery depicted below provided a nice backdrop to visually assess the accuracy of the ENVI LiDAR feature extraction functionality. Once the data was brought in, I got a rough measurement of one of the trees in relation to the point representing the tree base, and create a buffer around the trees to depict the extent of crown coverage in the area. As you can see ENVI did a pretty good job at capturing the building footprints and the location of the trees. The entire extraction process took a bit under 30 minutes, and while there were some discrepancies between the extracted features and the high resolution imagery, the quickness of the algorithm, combined with the ability to manually fix small issues that may arise with the data, equals a significant reduction in time from manually classifying and extracting features from LiDAR.
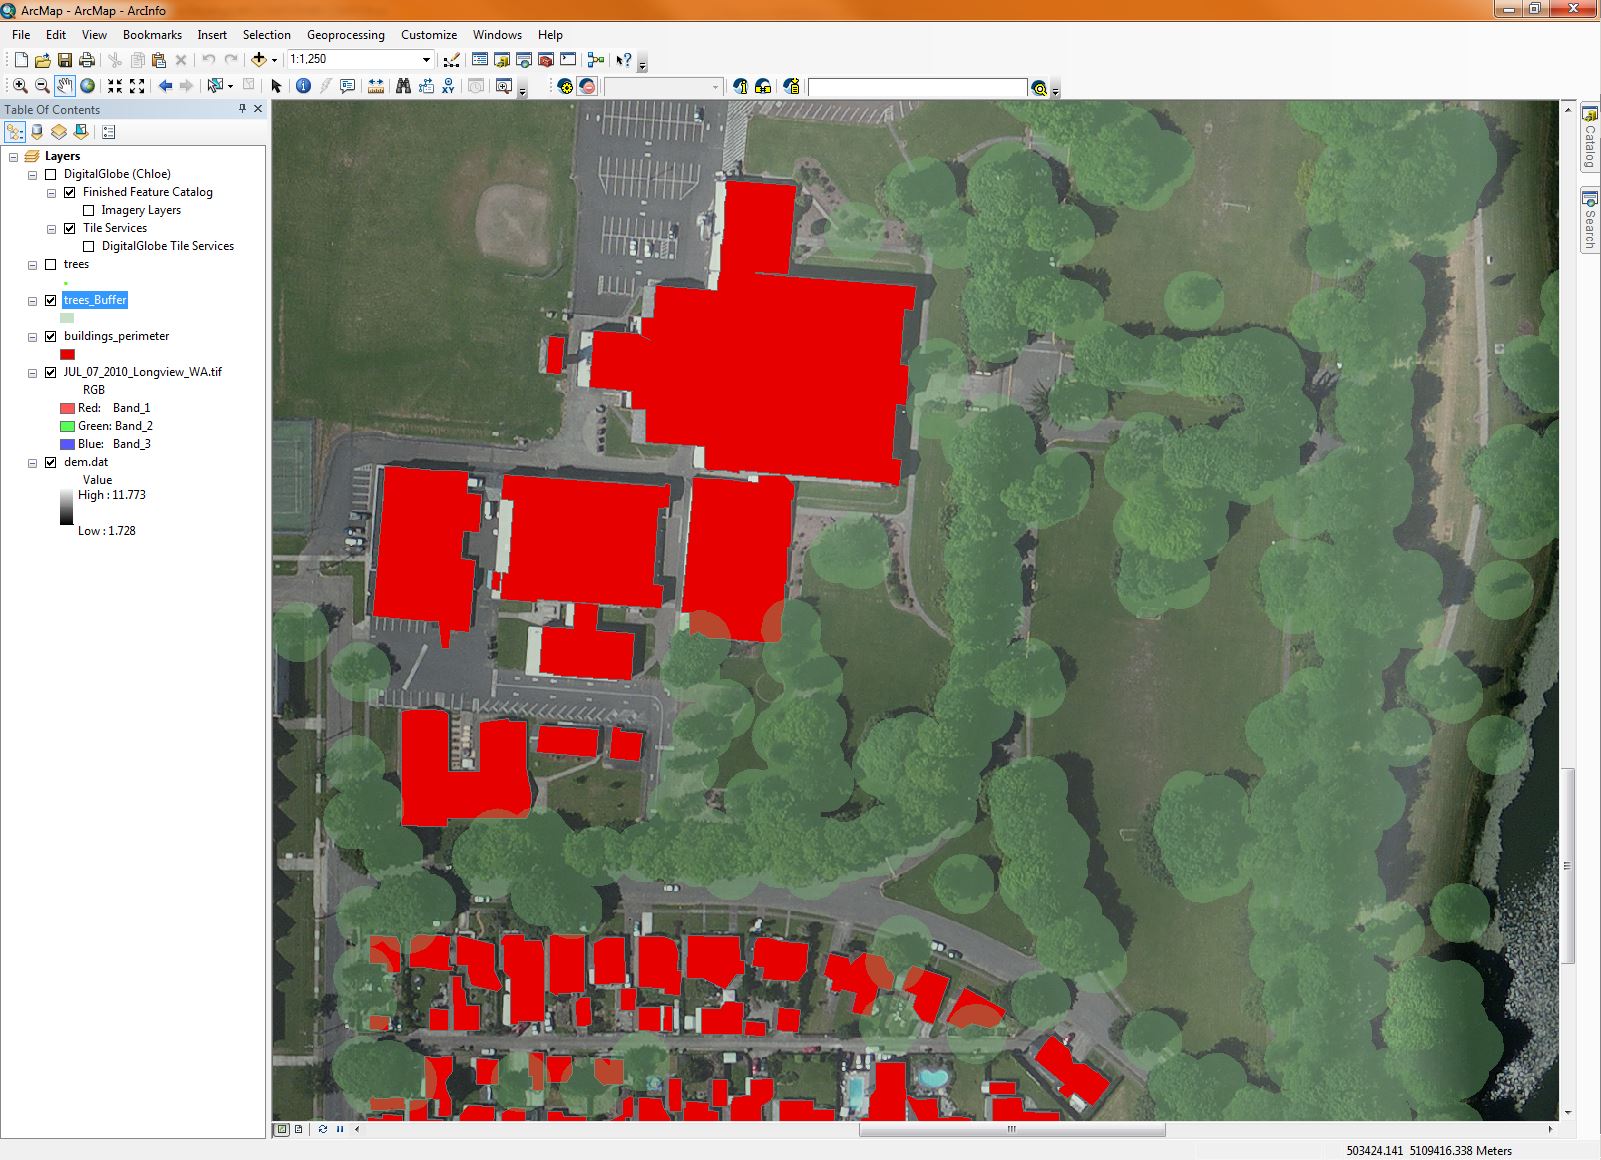
Data Courtesy of DigitalGlobe, Inc and NOAA
Finally, I was able to export all of my features to an ArcGIS geodatabase for later use, hosting on an ArcGIS for Server instance, or hosting on ArcGIS Online. What do you think? Are you involved in updating city database with tree locations or buildings vectors? What other features would be useful to extract from a LiDAR dataset?