Viewshed analysis for planning a sensor network
Anonym
Have you ever been curious as to what you might see from an overlook before planning to go there? Or perhaps why it's difficult to get cell phone reception in your area? These are the types of questions that viewshed analysis tries to answer, by taking a surface (including ground, trees, buildings) and analyzing each line of sight from the view point.
Often this analysis assumes you can look in any direction. Sensors however are usually limited by their field of view, pointing direction, effective range, and surface or terrain over which they operate. A fixed security camera will be able to image the area within its horizontal and vertical field of view. Areas outside this region, or areas occluded by buildings, trees, and hills, will not be visible. In a similar way, cell phone transmitters and receivers, as well as radar and sonar systems, have a limited beam width, direction, and effective range.
Before deploying a remote sensing or communications network, it is common to model the effect of different choices in operating parameters, as well as the number and distribution of sensors.
Just as viewshed analysis can help predict what you may see from a particular vantage point, it can also be a quick way to estimate the coverage of a network, before undertaking a more extensive and rigorous sensor model and operating environment analysis.
ENVI's viewshed analysis tools can estimate the effective coverage area of multiple sensors each with varying fields of view, locations and heights, effective ranges, and pointing directions. With ENVI's programming interface many scenarios can be evaluated and then visualized.
In this example, I use a surface elevation model derived from LiDAR and a satellite image over Boulder Colorado. The LiDAR data was obtained from Neon (National Ecological Observatory Network) and the imagery was obtained from DigitalGlobe and then orthorectified in ENVI.
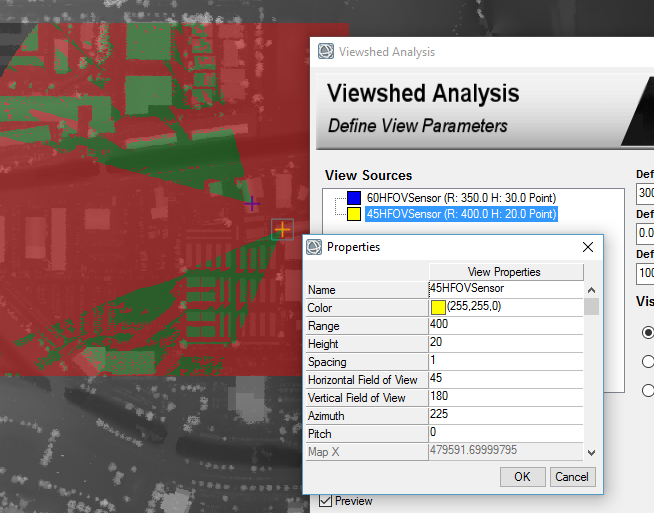
To perform a viewshed analysis on a network of sensors, launch the viewshed workflow from the toolbox, and add view points representing the locations of the sensors. Then in the view sources list right click or double left click to edit the view source parameters. Modify the range, height, horizontal and vertical field of view, pitch, and azimuth as needed. Points can be moved at any time by selecting them in the display and dragging them to a new location. Preview (as used in the following image) can be used to quickly view the results of parameter changes before producing the final result.
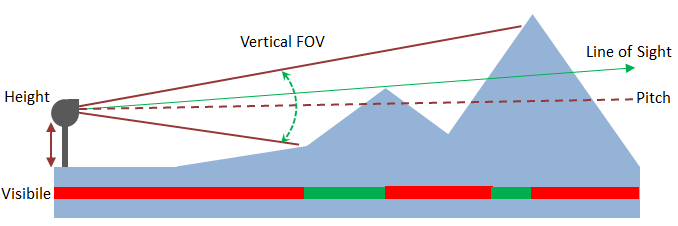
The following picture illustrates the impact of sensor height, pitch, vertical field of view, and terrain on the area that is visible (green) and hidden (red) by line of sight. The limited vertical field of view means that the area closest to the sensor as well as the top of the highest peak are hidden. By reducing the pitch (pointing the sensor downwards) the visible area can be brought closer to the sensor at the cost of loosing visibility to the higher terrain. The green arrow indicates one of the lines of sight within the field of view, specifically the line of sight that just clears the first peak and that defines the hidden area behind the peak.
To evaluate multiple configuration scenarios it is valuable to switch to ENVI's application programming interface. The RasterViewshed task can be run multiple times to evaluate network options.
The viewshed task is created using the following command.
task = ENVITask('RasterViewshed')
Then for each scenario, you can set one or many simultaneous view sources and parameters sets.
task.Pixel_Location = locations
task.Horizontal_Field_of_View = HFOVs
task.Vertical_Field_of_View = VFOVs
task.Pitch = pitches
task.Azimuth = azimuths
task.Range = ranges
task.Execute
Once complete the viewshed rasters can be combined into a raster series for visualization.
task = ENVITask('BuildRasterSeries')
So next time you want to pick a campsite with the perfect view, or set up a network of sensors, transmitters, and receivers, remember that viewshed analysis can be a powerful tool.