Tips for Creating a High-Quality Mosaic
Anonym
Working with the ENVI software engineering group gives me an opportunity to test new and enhanced features from the perspective of an end user. ENVI 5.3, Service Pack 1 includes some improvements to the Seamless Mosaic tool (and associated API) to better support Landsat imagery. I tried it myself by creating a mosaic using a coastline mask and by reducing the amount of visible cloud cover. I think the result turned out great. In this article I will share some tips that will help you to create a high-quality image mosaic.
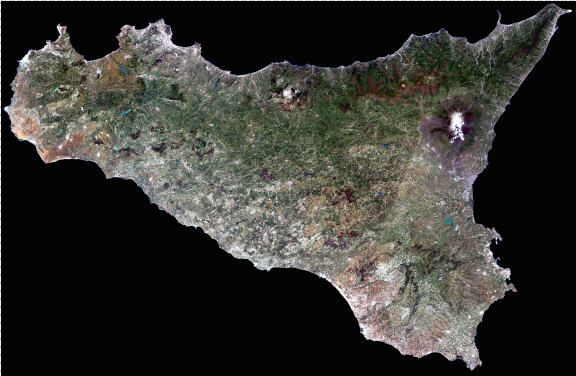
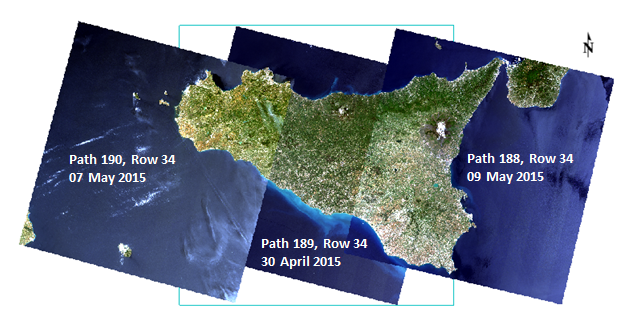
The above image is a true-color mosaic of Sicily comprised of three different Landsat 8 scenes. I chose this particular location because it has overlapping flight paths from different dates. The following figure shows the source images displayed in ENVI:
Choosing Images
Landsat 8 scenes are available for download from the U.S. Geological Survey EarthExplorer web site. Here are some tips for finding images that will produce the best visual quality:
- Images that are in different paths (like the illustration above) can vary significantly in color and radiometric quality. When choosing images from different flight paths, try to find those that are within the narrowest time frame possible. For example, the three source images that I selected were acquired within a 10-day period.
- Restrict the search to images with less than 20% (or better yet, 10%) cloud cover. The best chances for finding scenes with low cloud cover is during the summer months of the respective hemisphere, especially around sub-tropical latitudes.
The next steps involve a little preparation to get the images ready for a mosaic.
Preprocessing and Masks
The scenario that I’m describing here is producing a true-color mosaic for visual analysis. If you are creating a mosaic for spectral analysis, you should first calibrate the source images to spectral radiance and correct for atmospheric effects. You do not want to perform any color correction or feathering in the Seamless Mosaic tool since it would compromise the spectral integrity of the data.
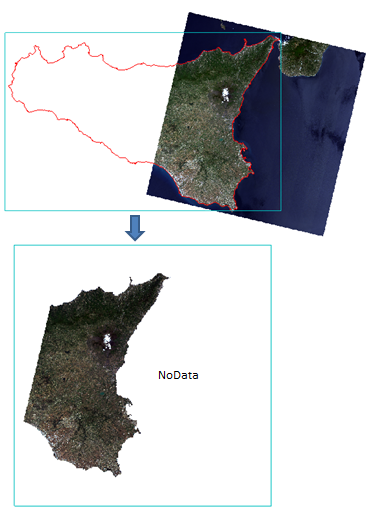
Ocean pixels can skew the statistics used for effective color balancing among the scenes. To begin the process of excluding ocean pixels, I downloaded the GSHHG high-resolution global coastline dataset (Wessel and Smith, 1996). I used ENVI to extract the vector record of just the Sicily coastline, then saved that vector record to a shapefile. I used the coastline boundary as a mask for each source image such that ocean pixels were labeled ‘NoData’. You could use this same process to confine your mosaic to an administrative or watershed boundary.
I saved each masked image to a new ENVI-format file that only included the visible bands. This would reduce the processing time in creating the mosaic.
Mosaic
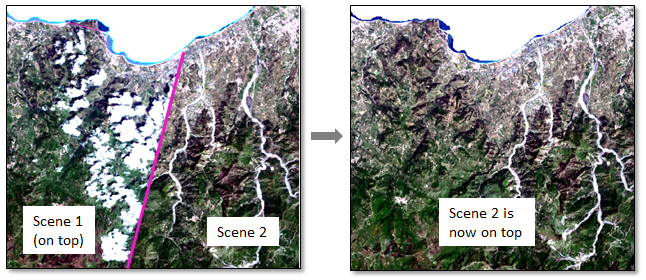
Once I imported the masked scenes into the Seamless Mosaic tool, I experimented with various display options (while previewing the results) to achieve the best visual quality. I knew that I could stack the scenes where they overlap so that a better scene is on top. The following figure shows an example where I reordered Scene 2 to the top of the display stack to hide unwanted cloud cover.
I experimented with some color-matching options and found that computing histogram statistics based on the overlapping areas (versus the entire image) more effectively minimized the tonal and color differences between scenes.
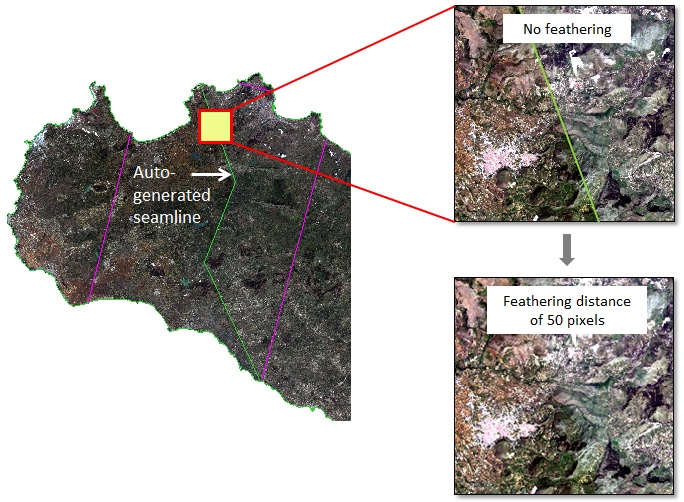
At the boundaries where the scenes meet, I chose to automatically generate seamlines with a feathering distance of 50 pixels on both sides of the seamlines. This eliminates any hard edges between scenes and more effectively blends the images where they meet.
Finally, I saved the mosaic to GeoTIFF format. The process only took a few minutes to complete. To learn more about creating mosaics, please visit the Seamless Mosaic topic in our online Documentation Center.
References
Wessel, P., and W. H. F. Smith. “A Global Self-consistent, Hierarchical, High-resolution Shoreline Database.” Journal of Geophysical Research 101 (1996): 8741-8743.