Web-Enabled GIS for Image Processing
Anonym
The use of the internet to consume and display geographic information has evolved rapidly over the past several decades. The first maps to be displayed over the internet were displayed as static graphic images in formats like GIF, JPEG, or PNG inside an HTML page. This first step in the use of the internet to display geographic information, while important, did not offer the kind of functionality that we have come to expect of today's web mapping applications. Today, we expect our maps to be interactive. We want the ability to zoom in and out. We want the ability to turn various layers on and off so that we can see exactly what we are looking for. The ability to do these things is something that we have not only come to expect, but something that we have come to rely on. Interactive web maps are on our desktops, on our tablets, on our phones and even mounted in the dashboards of our cars.
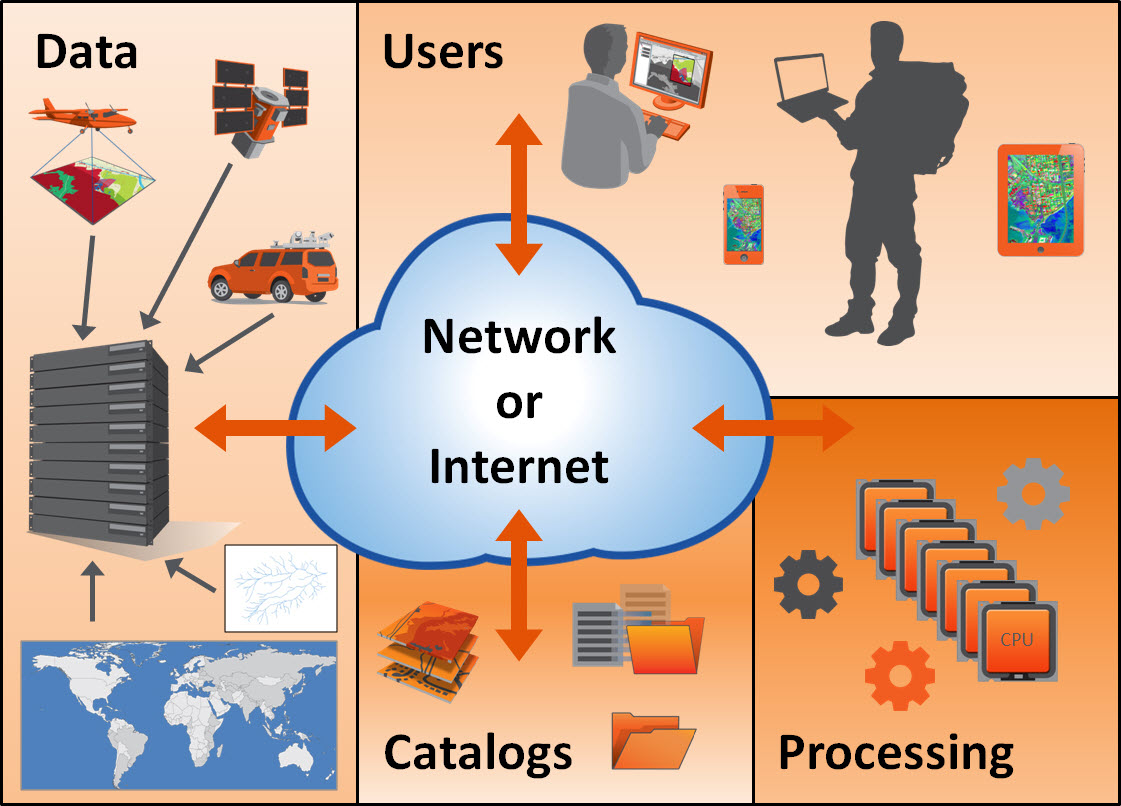
What's interesting is that for a lot of people that actually work in the geospatial realm, the use of web-enabled GIS in our personal lives might actually be outpacing what we do with it at work. Particularly in the field of remote sensing, I think that performing image analysis on a traditional desktop setup is still pretty much the norm. But I have a feeling this is all going to change pretty quickly. Some recent projects that I have been involved with here at Exelis VIS have opened my eyes to the possibilities of what the future of web-enabled image processing might look like. The advantages are clear. Web-enabled image processing allows users to take advantage of distributed data - meaning the data can be stored anywhere as long as you can access it on your network or over the web. Data might be sitting on your desktop, on a server within your network, or it might be sitting on a server on the other side of the world. You can use basemaps distributed by Esri® or other sources to display your data. You can pull in vector layers. You can catalog your data using a catalog such as Jagwire™. And using image processing capabilities, such as those found in ENVI Services Engine, you can run processing on whatever data you have access to. This "mashup" of data and data processing from a variety of sources is the future of GIS. What's exciting about this is that once you have configured your system, it's fairly easy to begin building custom web applications for displaying, processing, and sharing information derived from remotely-sensed data. The ability to quickly ingest, process, and disseminate valuable information to end-users is, in my opinion, what makes web-enabled image processing so exciting and a clear winner over traditional desktop image analysis methods.
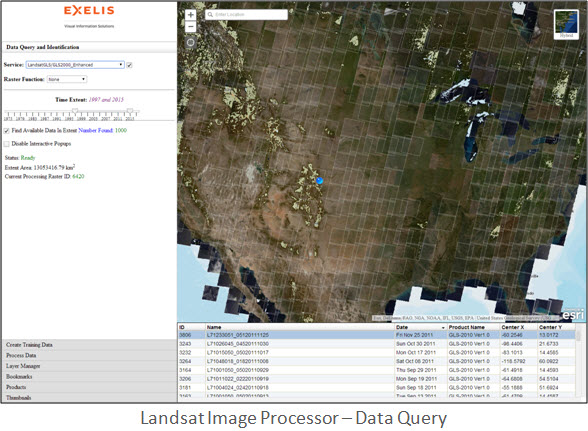
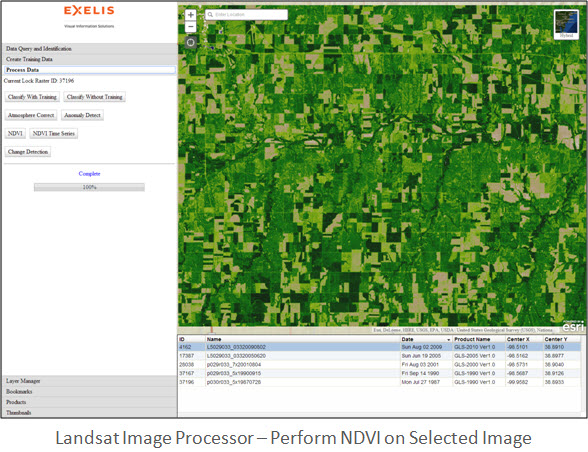
Let's go ahead and take a quick look at a couple of examples of what image analysis in the cloud might look like. In the first example (shown below) a simple user interface has been built using JavaScript. A Landsat imagery service provided by Esri® is used to access full resolution multispectral Landsat imagery. This data can be queried and displayed on an Esri® basemap. Once an image has been selected, various image processing options can be run on the data using functionality available through ENVI Services Engine. In the screen captures below, the first image shows an example of querying the Landsat image service data catalog. The second image shows an example of performing a Normalized Difference Vegetation Index (NDVI) on the selected image. With the configuration shown below, when image analysis is performed, the output data is stored on a local server and a PNG file is created to display the result on the Esri® basemap.
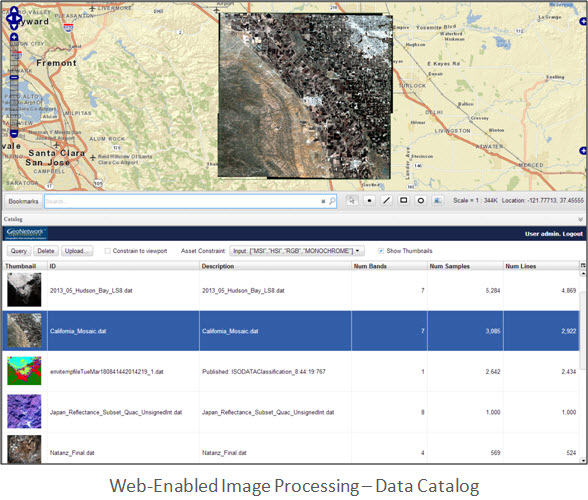
In the next example, rather than accessing an imagery service, we are using a catalog to access data that resides on a local server. Access to the application is controlled by a password. Anyone who has been given permission to access the application can access it from any location through a web browser. In this example, the Esri® Javascript API is again used to provide a basemap. Users can browse data that is available in the catalog, or they have the option of uploading data from their computer. This data will be added to the catalog and other users will be able to access it as well. Once an image is selected, image analysis can be performed using ENVI Services Engine tasks.
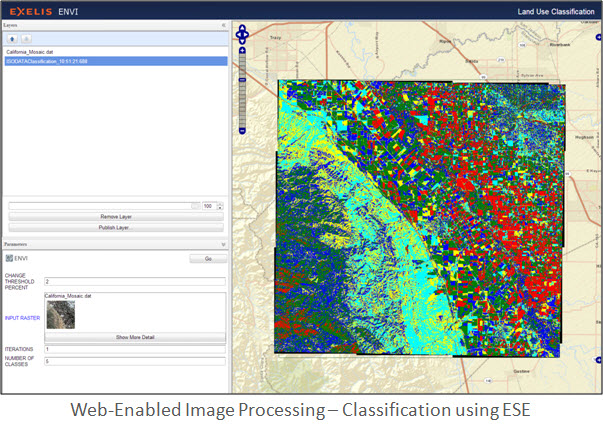
The future of web-enabled image processing is looking bright. It's exciting to think about all of the applications for this type of technology. Just imagine how easy it would be to track changes to glaciers, monitor forest fires, or even keep track of changes during a natural disaster using this type of technology. With the availability of data rapidly increasing, web-enabled image processing presents a method for accessing data and performing analysis to get real-world answers to real-world problems in a quick and effective manner.