What to Ex-Spectra When You're Reflecting
Exploring Absorption Features
Anonym
Reflectance spectra are at the core of spectral analysis, so discussing absorption features (spectral lines) requires a firm understanding of what spectra are and how they work in remote sensing.
A satellite sensor records the intensity of light at various wavelengths as received through the atmosphere and as altered by sensor distortions. An accurate pixel spectrum represents the reflectance of light from a pixel without sensor distortions, without any illumination variation from the solar irradiation curve, and without any atmospheric absorption. This process is completed through radiometric calibration and atmospheric correction. The radiometric calibration uses coefficients delivered in the metadata from the sensor to translate scaled sensor response data numbers to top-of-atmosphere spectra with physical units while addressing any systematic errors from the sensor. Atmospheric correction will use physical and numerical models to account for and remove the solar irradiation curve variations and atmospheric absorptions such as those caused by water vapor and CO2. These corrections deliver a reflectance spectrum that closely matches the “true” spectra that would be seen if the illumination were even across all wavelengths and if the light measured by the spectrometer did not have to travel through the atmosphere. Here is a figure showing a spectral profile of raw Landsat 8 data, over a vegetation pixel:
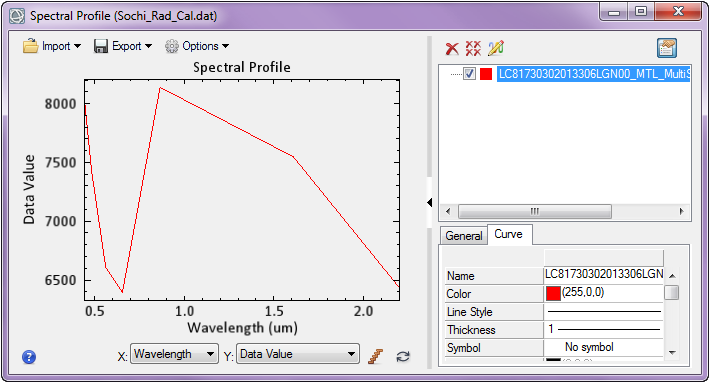
This figure shows a spectral profile of radiometrically calibrated Landsat 8 data, over the same pixel:
This figure shows a spectral profile of atmospherically corrected (using QUAC) Landsat 8 data, over the same pixel. (Note that the scale factor is different for this profile, mainly look at the differences in the shape of the curve):
The ability to analyze the reflectance spectrum of a pixel found in a scene has proved incredibly helpful for classifying those pixels, finding materials and targets of interest, and even for discovering materials previously unknown in the area. Analyzing spectra is incredibly useful in most fields of remote sensing, but specifically the mining industry and the defense and intelligence industry. Reflectance spectra can help pinpoint the precise location and abundance of a certain material, or with data that has high spatial resolution, maybe even specific elements that comprise a material. It is clear that a mining company would make great use of a map detailing the relative abundance of ores or indicator minerals found in a scene.
The process of analyzing spectra for absorption features to detect certain elements and compounds can be traced back to the groundbreaking work done by the astronomer Joseph von Fraunhofer at the turn of the 19th century. To condense a massively important and cutting-edge breakthrough in science into a blog post is difficult, but here goes. Fraunhofer was able to identify that viewing light through specific materials caused light at specific wavelengths to be absorbed depending on the chemical makeup of the material. This is due to the fact that photons at particular frequencies are absorbed by the chemical compound and thus show a “dip” in the spectrum, indicating the presence of that specific chemical compound. (The fact that the photons absorb this light means that there is a reduction in intensity, hence the “dip” in the spectra.) This would result in a spectrum of light showing some gaps, and these gaps can help indicate the chemical components of the object or pixel being analyzed.

All chemicals have specific absorption features, and identifying these “dips” in a pixel from a satellite sensor can give a user high confidence of the presence of that compound.
Singling out absorption features in reflectance spectra allows you to quickly ascertain the potential abundance of certain materials. This is best accomplished by comparing an example spectrum, usually a pixel found in your scene, against a spectral library containing actual measured spectra for a wide array of substances. A spectral library aimed at identifying the presence of heavy metals will contain different spectra than a library geared at identifying various vegetation types. This gets to a major point, as determining the abundance of certain materials in your scene will be wholly limited by the quality and diversity of your spectral library. There are many outlets available online to download spectral libraries through reputable sources. ENVI offers a wide array of tools intended to analyze spectra that match example spectra to materials in a spectral library. The THOR Material Identification workflow is a wizard that allows a user to simply take an example spectrum from a pixel found in your scene and see what spectrum from the spectral library, if any, match that example pixel.
The following figure is a screen capture of the THOR Material Identification Workflow:
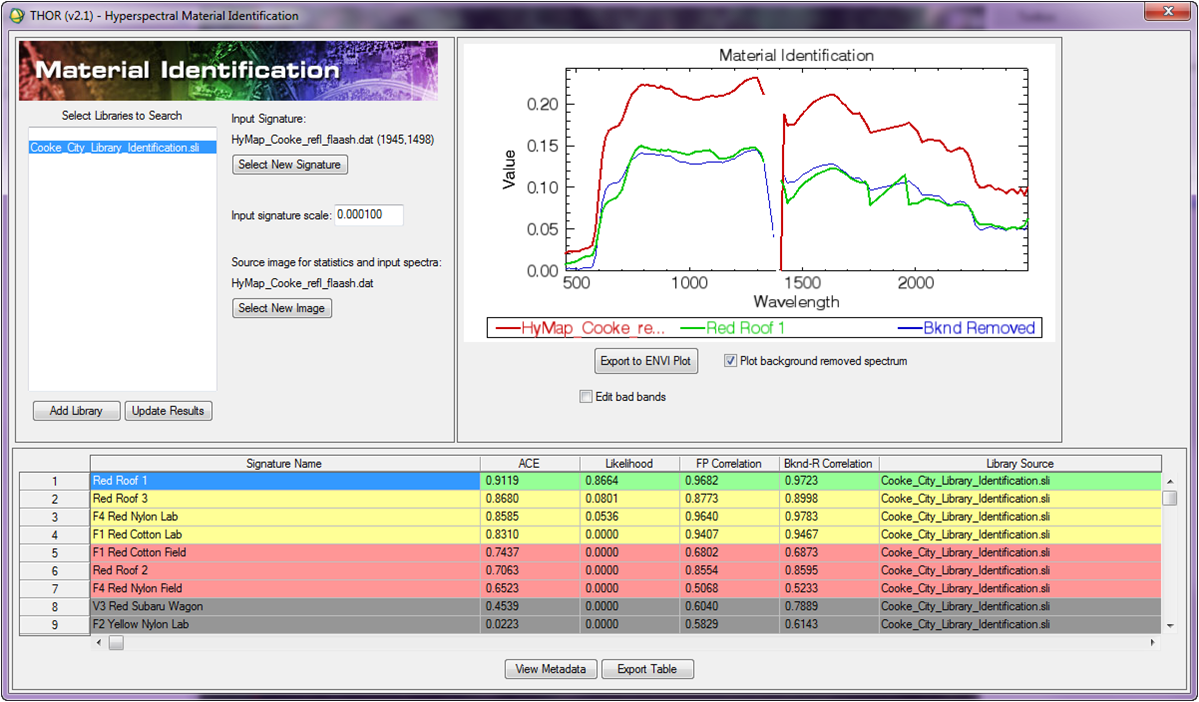
The Material Identification process is designed to quickly ascertain the potential abundance of certain materials in your scene based on their spectral features, reduces a significant amount of groundwork, and provides precise locations mapped out indicating a high likelihood of certain materials.