When Humans are the Vector: How to Track Disease with Imagery
Anonym
Listening to NPR this morning on the spread of Ebola got me thinking about tracking disease with imagery. Some diseases are well suited to monitoring with imagery because the vectors can be secondarily observed. I would consider secondary observation to be looking for thatched roofs in developing countries as potential sites for infestations of rodents that carry hanta or other diseases, or looking for logged areas in tropical forest, which upsets the natural drainage of water and can then become breeding grounds for mosquitoes, https://dukespace.lib.duke.edu/dspace/handle/10161/8551. Ebola, because of the methods of transmission, is a tougher beast to observe with imagery. But there are a couple ways one could use imagery:
- Looking for and identifying high-density urban areas where close person to person proximity could create higher risk
- Using imagery in conjunction with GIS to map areas of known virus presence, then use imagery to digitize roads or other transportation corridors that may or may not be mapped to better understand physical transport routes of the illness
- Trying to perform correlations with imagery derived information, e.g. statistically modeling whether transmission rates are higher in certain sized populations, near certain geographic features or near civic places
So after hearing grim statistics and not knowing much about equatorial West Africa, I set out to see what imagery I could find. Of the 10 scenes I could find from Landsat 8in 2014, only one was suitable for looking at Monrovia. Turns out Liberia is very cloudy, which is why SAR comes in so handy for cloudy environments. Even if you can’t observe exactly the same features with SAR, you can “see” through clouds, which is why SAR is so important to the cloudy parts of the world and why the Sentinel Mission with widely available no cost SAR data is so important.
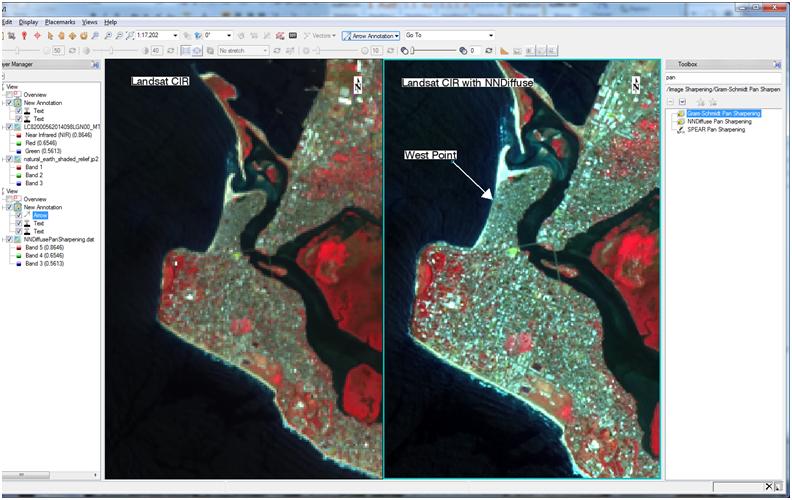
Here is a Landsat 8 image of the West Point area of Monrovia, Liberia. The right side is enhanced with the new NNDiffuse Pan Sharpening algorithm. Even though the Landsat pan band is only 15 meters, you get a much better idea of the density of that area once the data are sharpened. The imagery can still be used in spectral processing routines to extract further information.
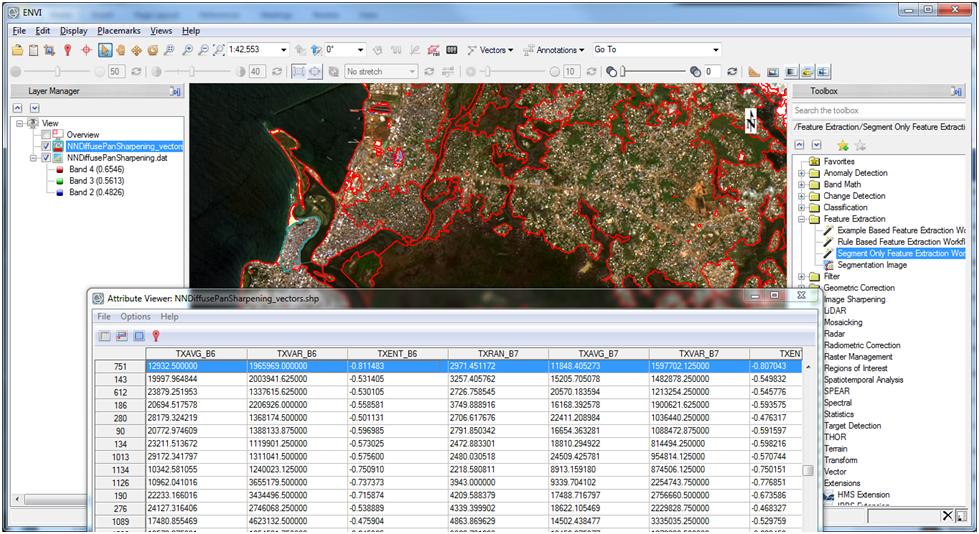
So at this point, you have data with higher resolution and retained spectral content, so I can run any ENVI spectral processing tools. In this case, I’ll use feature extraction because the segments created correspond well to human geographic features like more dense and less dense neighborhoods/districts.
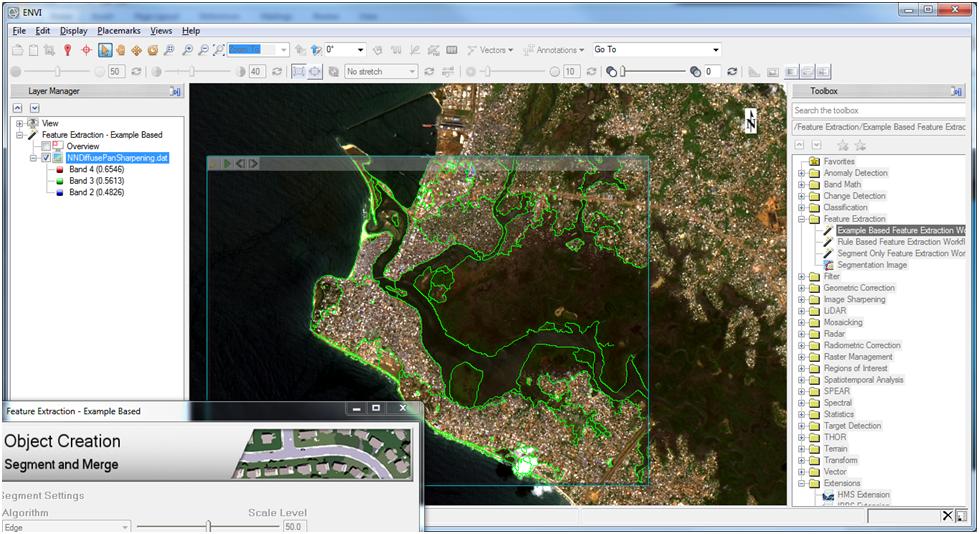
You can see in the figure above previewing the feature extraction segments, that the more dense neighborhood of West Point is extracted as a unique segment as are neighborhoods of other densities. Information like this could be used to prioritize education programs, health teams, field hospital locations, creating outreach messaging etc.
I also get spatial and spectral statistics about each segment that could help me if I was studying population density and trying to find other dense locations in the world and then compare that to socio economic data or if I were trying to understand density’s relationship to social justice or security. The key thing to making these discoveries is the availability of data that has sufficient spatial resolution that spatial and spectral differences can be extracted. The original Landsat data is ok for this type of work, especially for larger cities with district boarders, but more information could be extracted from hi-res data like Pleiades and WorldView data, but typically that imagery comes at a cost and the data are not always available, meaning the instrument hasn’t been tasked for every part of the world. NV5 Geospatial (formerly Exelis VIS) is working on an option to make high res data available to new users, I can’t go into all the details, just stay tuned in the next couple weeks.
While stopping something like Ebola takes Herculean hard work on the ground, imagery can help guide efforts and devise a plan for future prevention.
Follow me @asoconnor