If you have been following along in this short blog series, we have been working through the Spectral Hourglass workflow in an attempt to extract the location and abundance of pure endmembers in a Hyperspectral dataset captured over Cuprite, Nevada. We will be using products created through the previous blog posts, so refer to the links at the bottom of this post for background information.
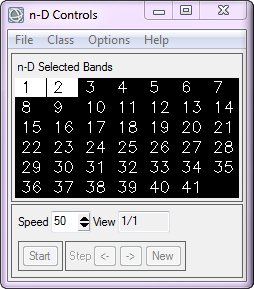
The n-D Visualizer is a tool used to select the purest pixels in an interactive display, and place them into a set of endmembers. ENVI plots the image data in all available dimensions into n-D space, where n is determined by the total number of bands in the image. After reducing the dimensionality of our dataset remember that we are working with 41 spectral bands. We are also working with refined image data, for we have established a threshold dictating only 524 pixels with a PPI value greater than 1400 are left in our dataset.
Within the n-D Visualizer you select a minimum of two bands to be plotted, but you can choose as many as you like. Recall that the higher-order MNF bands are noise dominated, so they will only help in locating very rare endmembers. After selecting at least three bands you then rotate the pure pixels around the axes of the bands. The n-D Visualizer rotates the pixels through different projections in MNF space and the rotations seem different when you include more than three bands. With more than three dimensions the data cloud appears to fold in upon itself as it rotates. This is because the multidimensional plot is being projected onto the two-dimensional screen, which is difficult for our minds that are adapted to seeing a maximum of three dimensions to interpret. This fact alone shows why a tool such as the n-D Visualizer should be used when analyzing hyperspectral datasets.
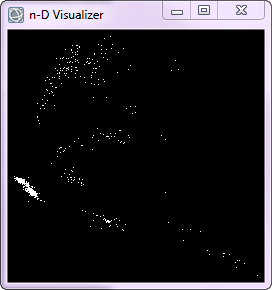
We are looking for pixels that form a corner in the data cloud and remain together throughout the various projections. The fact that these pixels form a cluster indicates that their image data is somewhat homogenous, and yet spectrally unique from the other image data in the selected bands, this indicates that these pixels could represent an endmember.
Single pixels floating in the corner of projections can indicate an endmember as well. By altering the speed of the rotation and the bands selected for projection, you will begin to notice some clumps of data in the Visualizer as well as single pixels in the corners. To create an ROI encapsulating these pixels you merely need to draw a polygon around the desired area.
Once an ROI is defined you must start the rotation again to watch the cluster defined by your ROI. If you see pixels in this ROI separate from the cluster in some projections, these pixels are probably somewhat different than the others. You can either clear the class and then redraw the ROI, or color the pixels that separate from the cluster something different.
Once you have selected a cluster of pixels as an ROI, more tools available within ENVI will help to refine this ROI.
It is ideal to identify the single most pure pixel in each cluster or corner. This would be the pixel that extends the furthest out toward the corner of the data cloud in some projections. This means that although it is perfectly acceptable to start the process of endmember selection with large groupings of pixels, you should refine your ROI selection to include as few pixels as possible. Sometimes it is very difficult to determine which pixel sticks out the furthest into the corner, and in those cases it is acceptable to include several pixels in one class.
To determine whether or not the pixels from a cluster should remain in the same class you may view their reflectance spectra directly from the n-D Controls dialog. By examining the spectra of pixels found within a cluster, you can determine if they are too dissimilar to be grouped together. Furthermore, if you are well-versed in the reflectance spectra of features found within your scene, you can quickly determine if certain pixels represent a material of interest.
After extracting a few endmembers you may begin to notice that it is difficult to locate other endmembers, even after altering the bands and rotating the data. To help remedy this issue you can collapse classes in ENVI by grouping endmembers you have already found into one group representing the background. What ENVI actually does in this collapse process is use plot the mean of the selected class as one pixel in the dialog. When employing this collapse option you will see a Collapse Class Eigenvalues plot appears, indicating the remaining dimensionality of the transformed data. The remaining dimensionality will be defined as being one less that the number of remaining endmembers.
Through the use of basic navigation and ROI creation within the n-D Visualizer, Spectral Profile plots to determine similarities/differences between image data, and collapsing already-defined ROI classes (endmembers) to determine the number of remaining endmembers, the n-D Visualizer is a hugely helpful analytic tool. Being able to view your image data in n-Dimensional space is not only an incredibly accurate way of locating endmembers, but it also can be a little fun!
After defining endmembers you can choose to export them to a spectral library as well as export them all as regions of interest (ROIs).
Our final step will involve identifying endmembers using the Spectral Analyst tool.
Read The Spectral Hourglass Series: Part 1, An Introduction
Read The Spectral Hourglass Series: Part 2, Spatial/Spectral Browsing and Endmembers
Read The Spectral Hourglass Series: Part 3, Hyperspectral Data Reduction
Read The Spectral Hourglass Series: Part 4, Spatial Data Reduction and Pixel Purity Index