IDL 8 Workbench Reference
NOTE: This article was written for the IDL 8.2.1 workbench however it is still relevant for current IDL versions. Though some of the icons and graphics may have changed, this document should still serve as a pretty good reference.
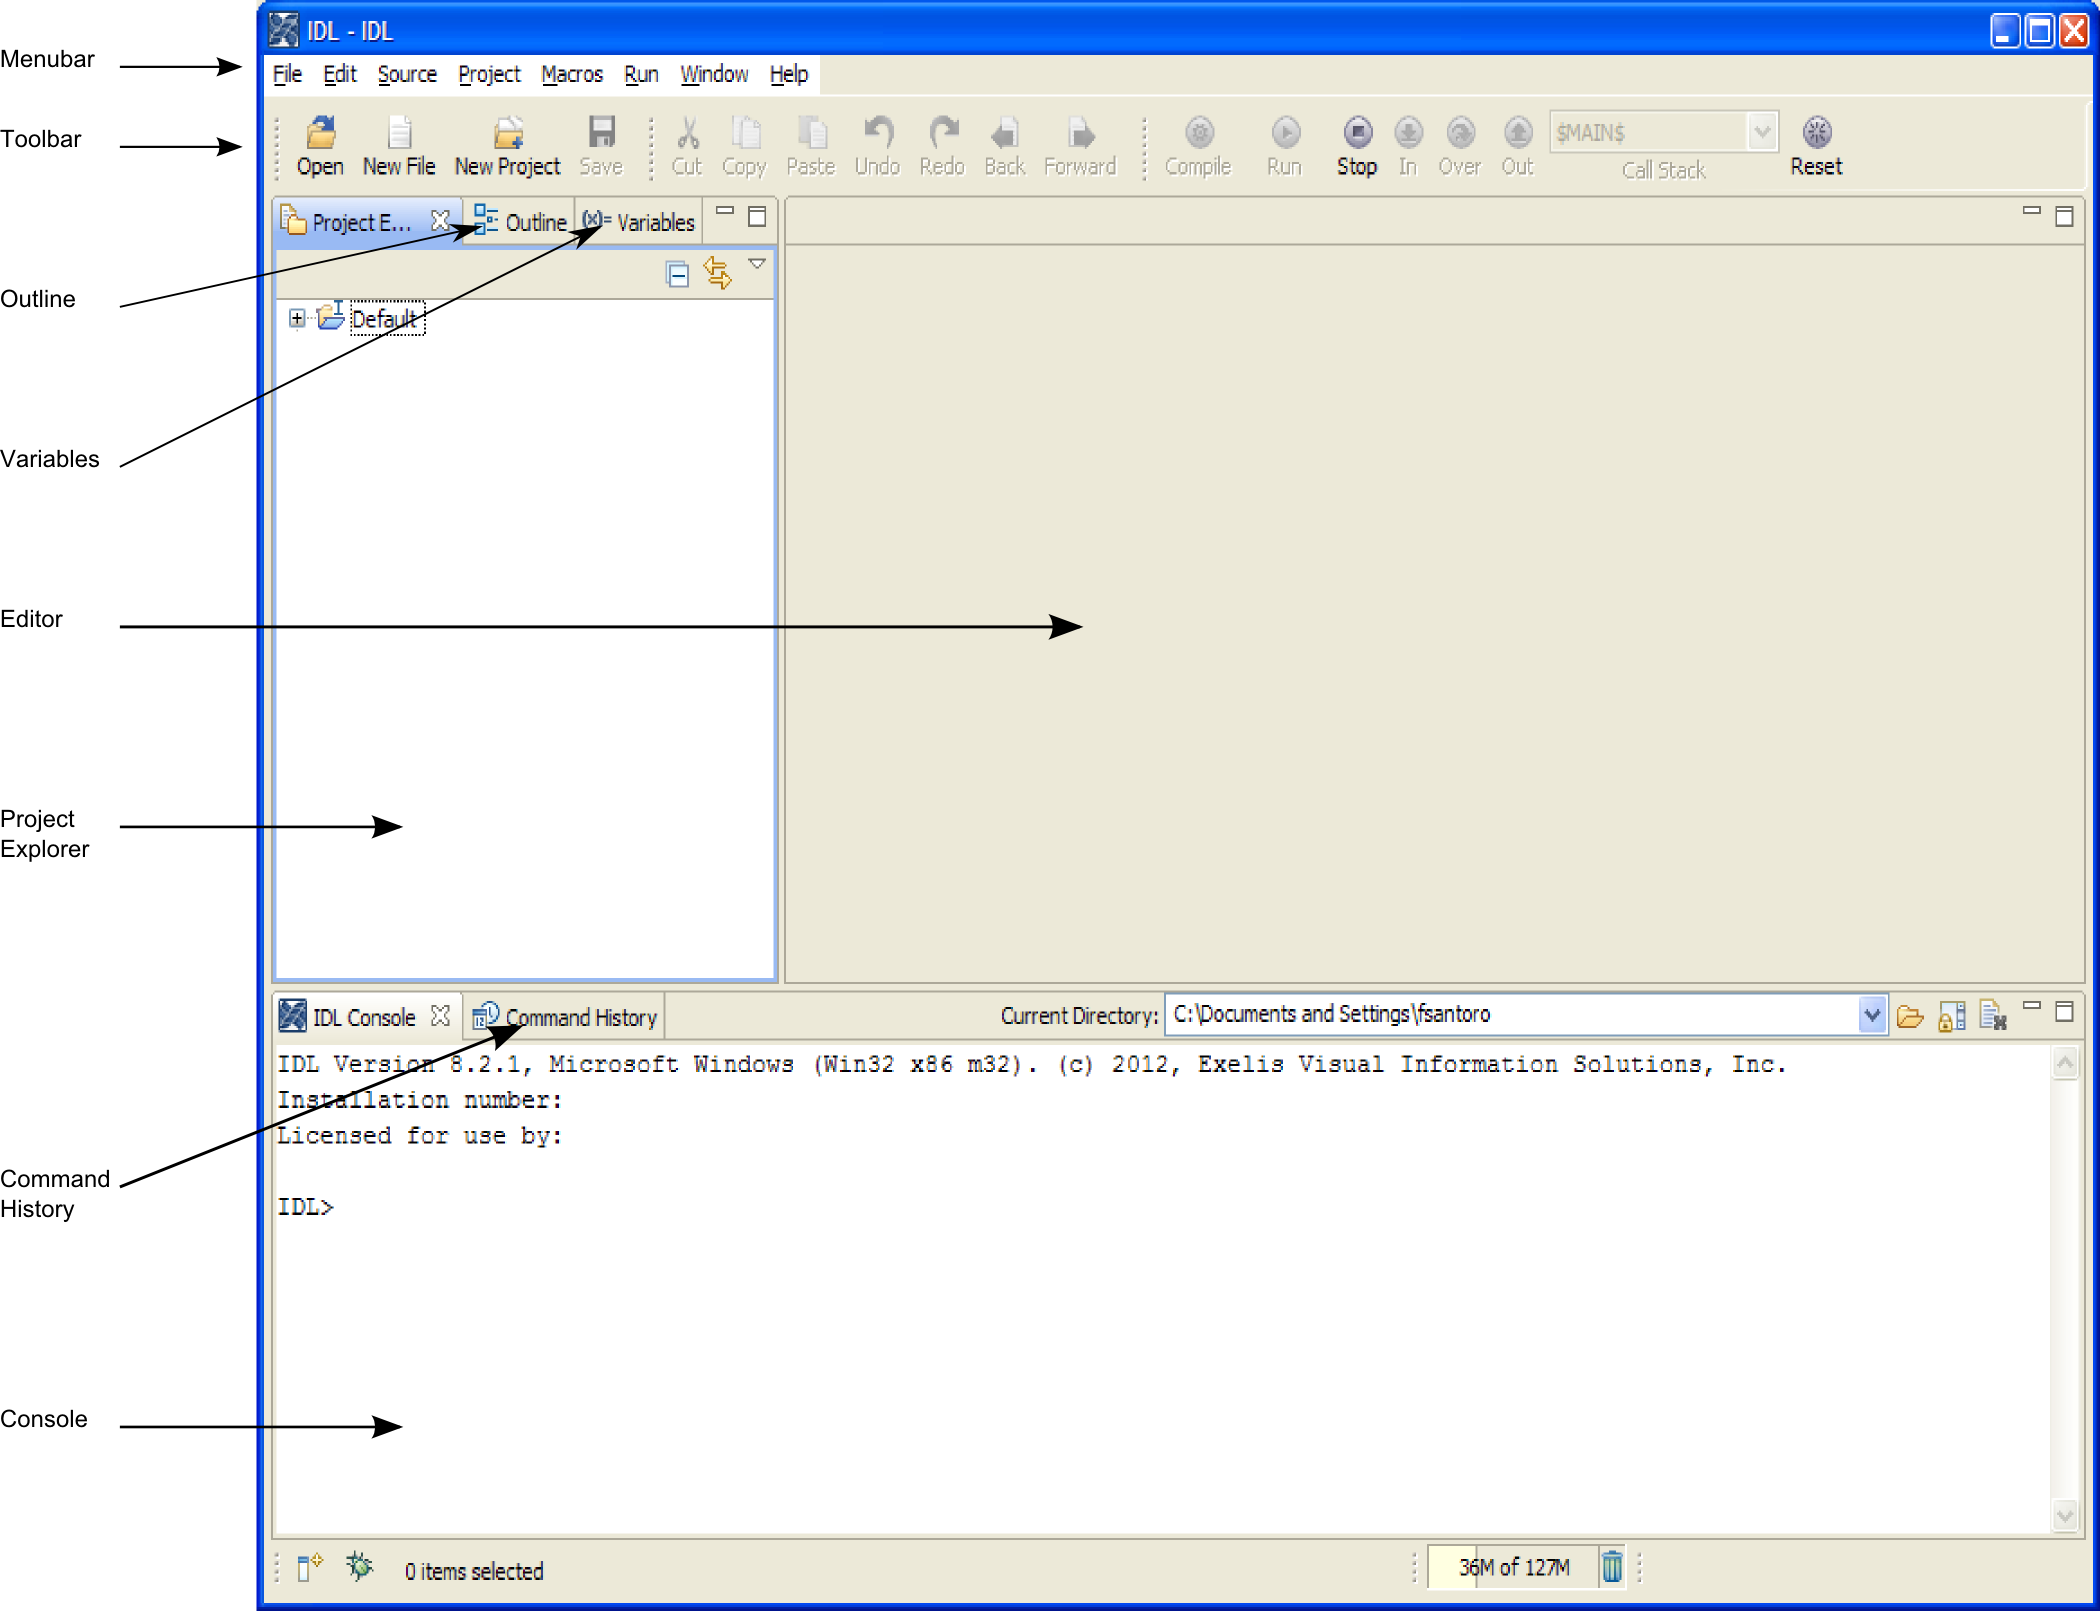
The purpose of the article is provide a list of the tools available in IDL 8 Workbench that users can reference. This article is divided into sections based on some of the main views available in the IDL workbench. Some of the views that can only be opened in the IDL 8.2.1 Workbench are labeled in the diagram below:
More information about how to use the workbench can be found in the following Help Article:
Help Article 5300: The IDL Workbench Guide
There is also a YouTube video that takes the user through some of the basics of the IDL Workbench. To view the video, please go to the following address:
http://youtu.be/TTeZbFWy8YI
Menubar view
This view is the standard drop down menu. It has controls for opening, editing, compiling and running IDL programs. It has controls for interacting with other Workbench features. A list of the options included in the each of the menu items is shown below.
NOTE: The list below describes the items in the Menubar view as they appear on Windows. However, there are some differences between the Menubar on Windows and Mac platforms. On Mac, the Menubar view appears across the top of the screen (not part of the Workbench window). Also on Mac, there is an 'IDL' menu item within the Menubar view. Items listed below with (*) next to them are relocated in the 'IDL' menu item on Mac. In addition, on Windows, a lot of the keybindings use the Ctrl key. On Mac, these key bindings use the Command key.
File
- New File - Opens a new file in the editor window
- New Project - Opens the "New IDL Project" dialog that can be used to generate a new project
- New ENVI extension - Starts a wizard to generate a new ENVI extension
- Open - Opens a file. If you select a ".pro" it will open in the editor. If you select an image it will open in an IMAGE window. If you select an ASCII file it will open in the ASCII template.
- Close - Closes window in editor
- Close All - Closes all windows in editor
- Save - Saves any changes to current file selected in editor
- Save As - Save current file in editor to new file name
- Print - Prints file currently selected in editor window
- Switch Workspace - Restarts IDL in different workspace
- Import - Allows user to import files, project, preferences, etc
- Export - Allows user to export files, preferences, etc
- Properties - Provides information about the file selected in the editor window
Edit
NOTE: The keybindings listed in this sections (and elsewhere in the article) are the default settings and can be customized.
- Undo - Ctrl+Z (Command+Z on Mac)
- Redo - Ctrl +Y
- Cut - Ctrl + X
- Copy - Ctrl + C
- Paste - Ctrl + V
- Delete - Deletes selected item/text (Delete)
- Select All - Ctrl + A
- Find/Replace - Ctrl + F
- Find Next
- Find Previous
- Search - Seeks files containing specified string in a scope selected by the user. The Search view will appear with the results (Ctrl+H)
- Go to Matching Bracket - If the cursor is on a bracket in the editor, this will move the cursor the matching bracket (Ctrl+])
- Go to line - Moves cursor to specified line (Ctrl+L)
- Back - Moves cursor to previous location (Alt+Left)
- Forward - Inverts the Back command (Alt + Right)
- Set Encoding - Sets the encoding (default UTF-8) for the file selected in editor
Source
- Format - Automatically format file in editor or selected text
- Shift Right - Tab selected text (or whole file) to the right
- Content Assist - This will help you enter commands (Ctrl-space)
- Code Templates - Templates to help users write IDL code.
- Toggle Comment - Switches selected text to comment or to code if already comment
- To Lower Case - Ctrl + U
- To Upper Case - Ctrl + Shift + U
- Open Declaration - Opens the .pro code for a selected call to a user defined routine (Ctrl + F3)
- Add Routine Comments - Helps input IDLdoc style comments for routine
- Add File Comments - Helps input IDLdoc style comments for file (http://idldoc.idldev.com/)
Project
- Open Project - Opens selected closed project
- Close Project - cCloses selected open project. Resource files in a closed project cannot be changed or accessed by the workbench. Closed projects take up a lot less memory.
- Build All - Builds all projects in workspace
- Build - Builds the selected project according to the IDL Build Properties. By default the IDL will compile all .pro code in the project, execute RESOLVE_ALL and create a save file with the project's name.
- Set Selection as current working directory - Set the current working directory to the location of the project
- Properties - Produces dialog that allows user to edit properties for selected project. The properties include: Resource, IDL Build Properties, IDL Compile Order, IDL Project Properties, Project References
Macros (IDL 8.2.1)
From "What's New in IDL 8.2":
Macros is a menu option now available in the IDL Workbench. Macros allow you to assign IDL code to icons and keyboard shortcuts. You can use macros for tasks that you repeat often or want to simplify. When you add custom macros, you can define:
- The IDL code that the macro runs
- The macro name and menu label
- An icon to display on the macro toolbar
- A custom tooltip to display on the toolbar icon
- A keyboard shortcut to run the macro
Run
- Resume - Continue to run paused program
- Pause - Pauses code being executed by the debugger
- Stop - Stops execution (Ctrl+F2)
- Step In - Steps through code line by line. If a command is defined in .pro code, the file will be opened in the editor and it step though this code line by line (F5)
- Step Over - Steps through code in current scope line by line (F6)
- Step Out - Executes remaining code in current scope then moves to next line of higher scope (F7)
- Skip - Skips line when debugging (Ctrl+Shift+F6)
- Run to line - Will execute code until location of cursor when debugging (Ctrl+R)
- Compile - Compile file selected in the editor view (Ctrl+F8)
- Run selected text - Executes the commands selected in the editor view (Shift+F8)
- Compile and run - Compile and execute file selected in editor (F8)
- Run Project - Executes the save file created by Build Project (Ctrl+shift+F8)
- Toggle Breakpoint - Add or Remove breakpoint from line selected by cursor (Ctrl+Shift+B)
- Remove all Breakpoints
Window
-
Hide Toolbar
- Breakpoints - Shows the location of breakpoints in code (Alt+Shift+Q,b)
- Command History
- IDL Console - Shows the IDL Console view (Ctrl+I)
- Outline - Shows an outline of the file selected in the editor view (Alt+Shift+Q,o)
- Profiler - Shows the Profiler view. This can be used to test the speed of code
- Project Explorer - Show Directory tree for projects in the workspace
- Variables - Shows Variables view which displays information about the variables currently defined (Alt+Shift+Q,v).
- Show View - Show misc. views
- Source Control Tools - Allows user to access repositories for code
- Reset Views - Sets views back to default layout
- Increase Font Size - (Ctrl++)
- Decrease Font size - (Ctrl+-)
- Preferences - Launches dialog box that allows user to adjust IDL preferences (*)
Help
- Help on selected item - Displays the IDL on-line help to the page corresponding to the item selected by the cursor
- Help Contents - Displays the IDL on-line help
- Key Assists - Shows the keyboard shortcuts available in Workbench
- About IDL - Gives version, build ID, and copyright information for IDL (*)
IDL (only on Mac)
- About IDL
- Preferences
- Services
- Hide IDL - Command+H
- Hide Others
- Show All
- Quit IDL - Command+Q
Toolbar View
This view includes graphical controls similar to the controls available in the Menu Bar view. A list of options available in the Toolbar View are shown below:
If you have Macros defined and you select "Show Toolbar", a toolbar with you Macros will appear in the Toolbar view.
Project Explorer
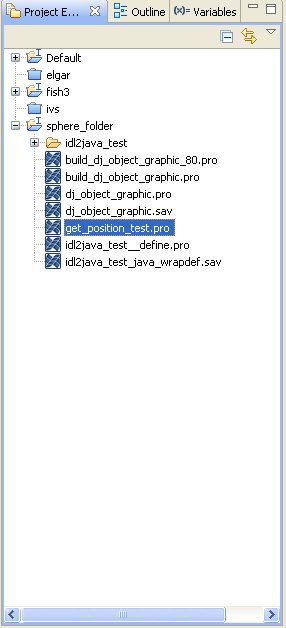
You can use the Project explorer view projects in the current workspace. You can click the "+" sign next to the project to see the contents.
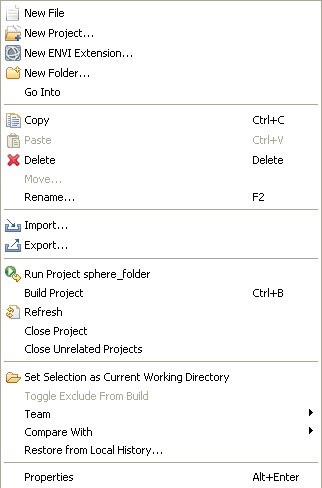
If you right click on the project name, you can perform many operations on the project. Some of the operations you can perform on the project are: opening/closing , importing/exporting, building, etc. An example of the dialog that displays when a project is right-clicked is shown below:
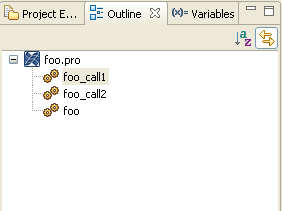
Outline View
This view displays an outline of the routines included in a file. If you click on the routine, it will display the code centered in the Editor view. By default, the routines are listed in the order in which they appear in the file. They can also be sorted alphabetically (click on the AZ symbol in right hand corner).
Variables View
This view displays the variables that have been within the current scope of the IDL session. An example output of the Variable View is shown below:
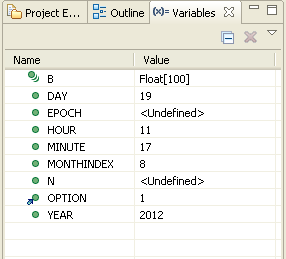
This screen capture was taken when IDL hit a break point in some ".pro" code. Variables with a value of <Undefined> are present in the ".pro" but their definitions have not been executed. You can delete variables by selecting them and clicking the "X" button or right-click and select delete.
Editor View
In this view, you can write, edit and debug IDL programs. An example of a file opened in the editor view is shown below:
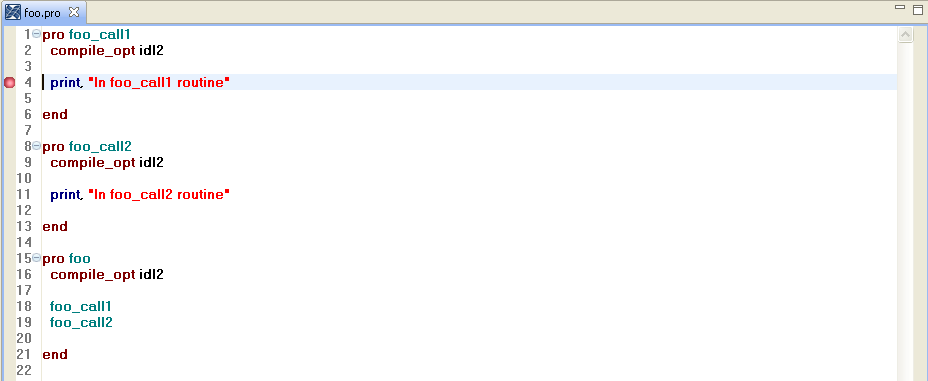
The red circle in the in the grey bar on the left hand side of the view is a break point. These can be added by double clicking in the grey bar next to your code. The line numbers do not appear by default. To turn line numbers on, right click in the white bar next to the code and then trace to "Show Line Numbers" in the menu that appears.
You can also use CTRL-M to maximize/minimize the editor window. You can can also put the mouse over a routine call that will display the help information about the routine. You can also hit F1 to bring up the IDL help. If you use Ctrl+left mouse click on a user defined routine call to open the source code. Matches to selections in the file will be highlighted. For example, selecting "print" in line 4 of the screenshot, would also cause the Workbench to highlight "print" in line 11.
Syntax coloring is another helpful feature when developing code. The coloring for the syntax is shown below:
- Dark blue - system routines (defined using C)
- Light blue - Routines defined using IDL
- Red - Strings
- Brown - Reserved Words (Click here for more information)
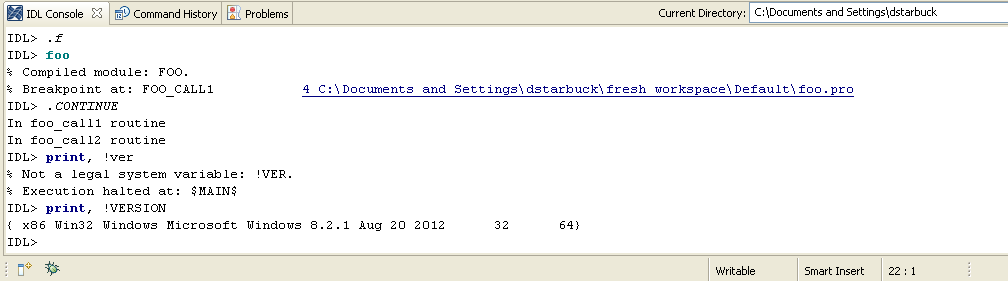
Console
In this view, you can enter IDL statements (at the IDL> prompt). Information for the user (such as output from programs, errors, warnings, etc) is displayed in this view. An example of IDL I/O in the console is shown below:
Some other features that are included in Console view include:
- Content Assist - If you start typing a command, you can hit Ctrl+Space on the keyboard and Workbench will provide options on how to complete it.
- Syntax highlighting - The syntax entered into the console is highlighted using the same color scheme as the Editor view
- Access commands from your history using the Up and Down arrow keys
- If you start typing a command you entered previously, you can hit the Tab key and the Workbench will automatically enter your previous call.
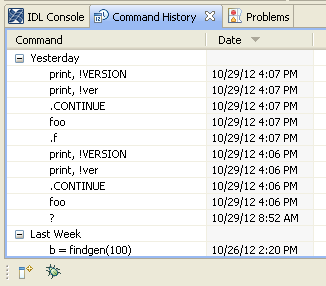
Command History
This view shows a list of recent statements entered in the Console. You can double-click or drag-and-drop statements from ere to the Console or the Editor.
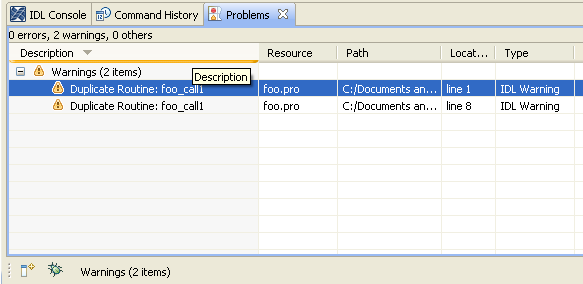
Problems (Collision Detection- IDL 8.2)
This view displays routines with the same name that are located in the IDL path. IDL only has one namespace, so if there are multiple routines with the same name in the IDL path, the right one might not be executed.
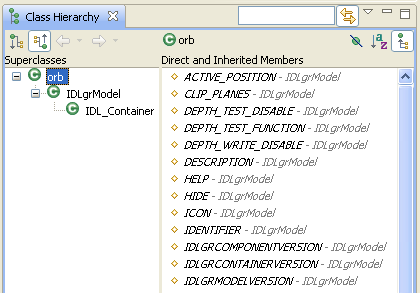
Class Outline (IDL 8.2.1)
This outline shows the superclasses or subclasses for an object. It also shows the direct and inherited members of the the class. To open this view, go to Window > Class Hierarchy in the to menu.
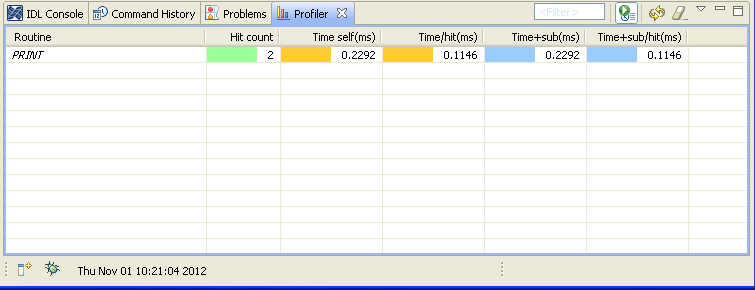
Profiler view
This view allows users to analyze the time efficiency of their code. It provides information about the number of times a routine is called and the amount of time it takes the code to execute. To display the Profiler view, go to Window > Profiler.
Reviewed by DS 9/17/2014