Exploiting the New SWIR Bands of WV-3
Anonym
I’ve recently been fortunate to have the opportunity to explore the new SWIR bands of Worldview-3 imagery (from Digital Globe). One of the most useful features of working with the SWIR bands is that many minerals have a unique spectral response at the strategically placed wavelengths of the sensor. When treated properly, Worldview-3 SWIR data make material identification at high spatial resolution a new reality.
There are several analytics outside the typical multispectral data analysis toolbox that are useful when working with SWIR bands. One of these that might not immediately come to mind is the minimum noise fraction (MNF) transform. Typically the MNF transform is used to separate noise from signal when working with hyperspectral data. However, it is also a great tool to derive bands that have highly unique and spatially coherent information. Take a look at the example below:
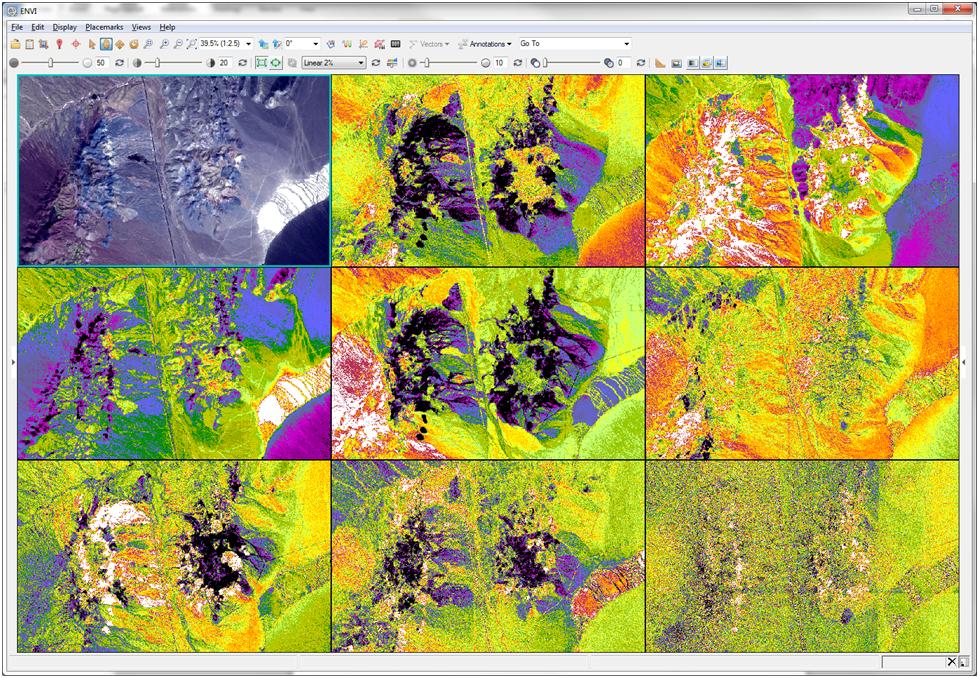
Figure 1: Worldview-3SWIR imagery – Cuprite, NV courtesy of Digital Globe. Upper left false color composite of SWIR bands 5,6, and 8 (2165, 2205, and 2330nm respectively). Next 8 images from left to right and top to bottom are MNF bands 1-8. Radiometric calibration and atmospheric correction were performed prior to MNF transform.
As you can see in each of the MNF bands, various materials become spatially coherent in each band. Because of this, MNF transforms are very useful when end member collection is an important part of the classification process. Take care to not exclude bands – even noisy ones – when you are trying to extract a material that is not abundant in the image – it might be spatially coherent in a band that otherwise contains mostly noise. From here, you might use additional tools like the pixel purity index to identify end members in the scene for use as input to supervised classification algorithms. Or alternatively, use sequential Maximum Angle Convex Come (SMACC) to derive end members and their abundance prior to classification.
While end member selection and supervised classification are excellent analytics for material identification from SWIR wavelengths, an additional technique to explore is to use spectral indices. Mathematical relationships between bands can be exploited to characterize what’s in a scene. One quick example is using the same scene above as input is to calculate the Clay MineralRatio. There are hundreds of published spectral indices out there. As I continue to become more familiar with these new data products I’ll be sure to let you know what Idiscover. Please do the same!
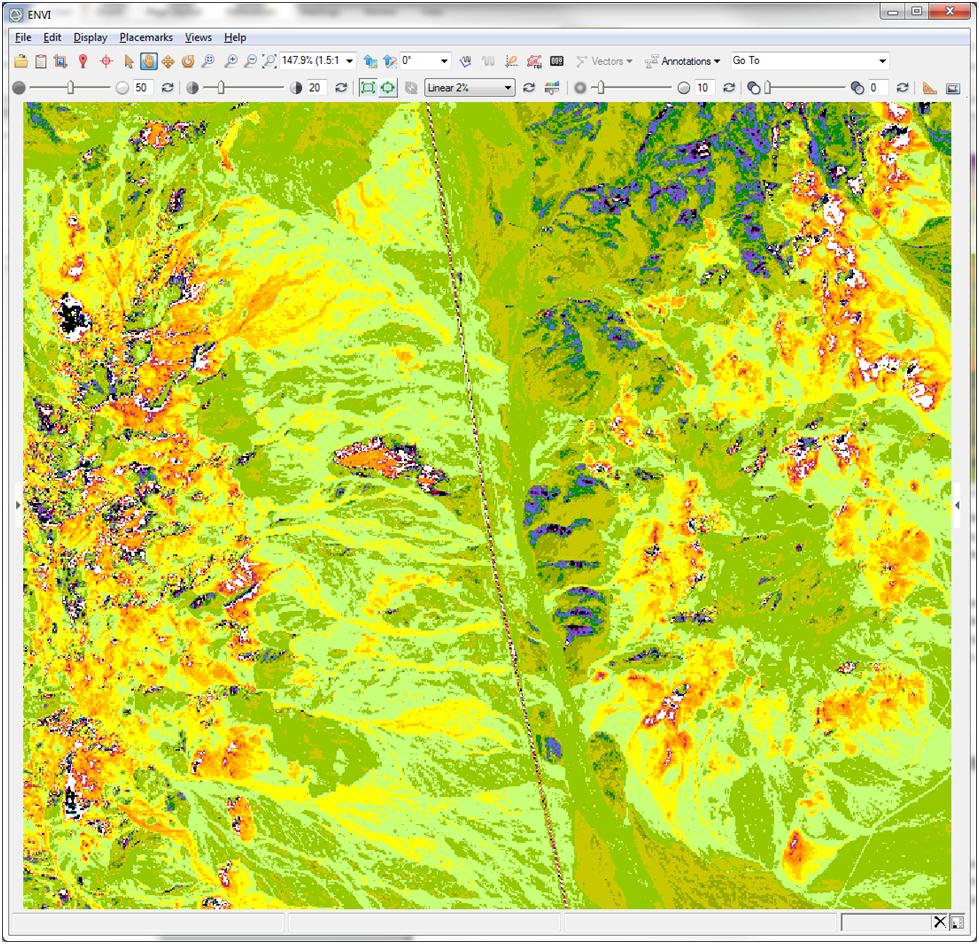
Figure 2: Clay MineralRatio with Rainbow 18 color table applied.
Take a deep dive into the MNF transform and learn more about DigitalGlobe SWIR imagery.