Fracking the Right Way
Anonym
The hydraulic fracturing of US shale formations to extract natural gas has yielded both great profits and great controversy over the past 20 years. Proponents of the technology claim it stimulates local economies and is a low-impact way of subsidizing our country's reliance on foreign oil. Opponents say it is a hazardous practice that can contaminate air and water resources and increase seismic activity due to destabilized bedrock. The Federal government provides some of the regulation over hydraulic fracturing, however the majority of policy regulating this industry is decided at the state level. This means that regulations differ from state to state, and it is up to the drilling party to understand the regulations they are operating under.
Site setback regulations for the industry are generally centered around water resources and populations of people. A whitepaper put out by the West Virginia University College of Law nicely summarizes the regulatory approaches of New York, Ohio, Pennsylvania, and West Virginia. According to this study setbacks for natural gas drilling operations state that a new vertical well bore shall not be within 500 feet of buildings or water wells, within 1,000 feet of water resources used by purveyors, or within 300 feet from streams, springs, wetlands, and other water bodies. Remember those numbers, as they'll come into play in a minute....
Aside from the regulatory restrictions placed on drill operations, businesses may also have best practices that they employ when choosing a site as well. This might include the original slope or area of the proposed site. There are numerous geospatial data modalities that can assist in selecting a suitable drill site based on a combination of the regulatory requirements and the business best practice. Satellite or aerial imagery, LiDAR, and vector files can all be fused together to give operators a complete picture of a potential site prior to sending valuable resources out into the field.
For this case study I found a great LiDAR dataset on Open Topography located over the town of Petersburg, Pennsylvania. Petersburg is located on the Marcellus formation in central PA, which is the largest source of natural gas in the United States. From this LiDAR, I was able to extract a high resolution digital elevation model (DEM), as well as the vectors for all of the buildings within the scene. I downloaded some vector files from the US Census Bureau which included water bodies in the area, which would allow me to ensure I was meeting state setback regulations.
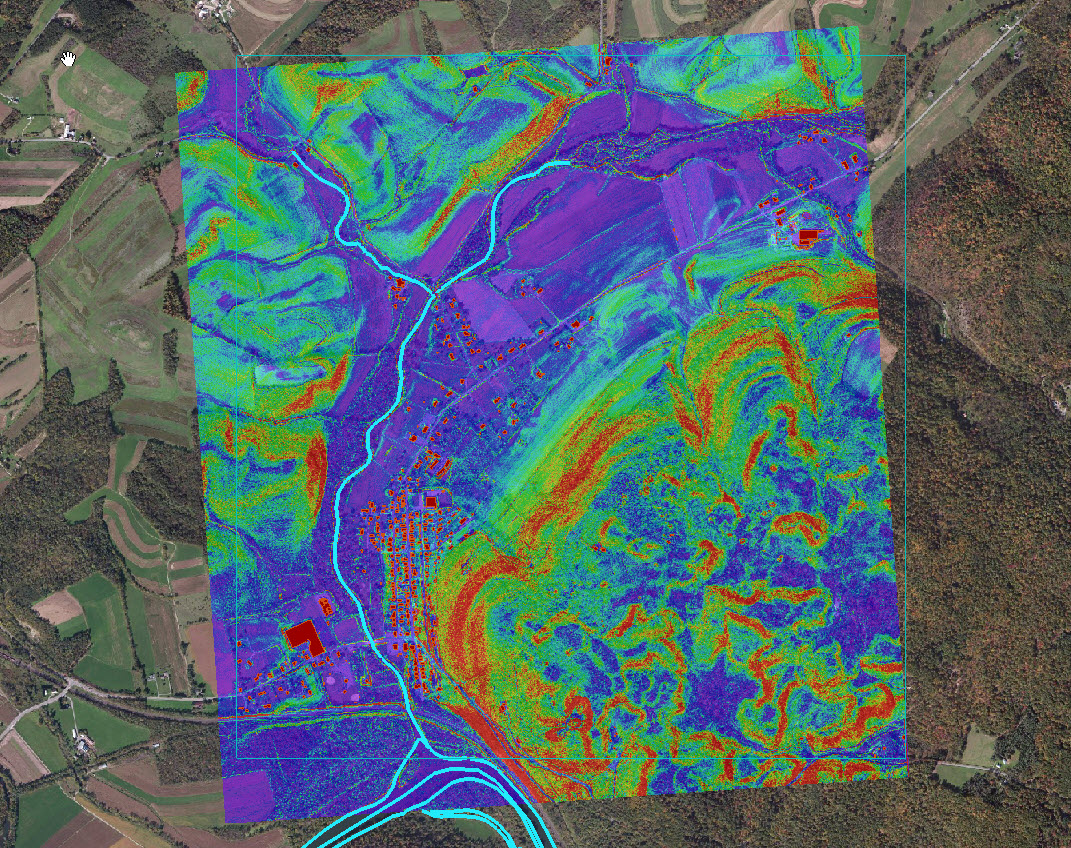
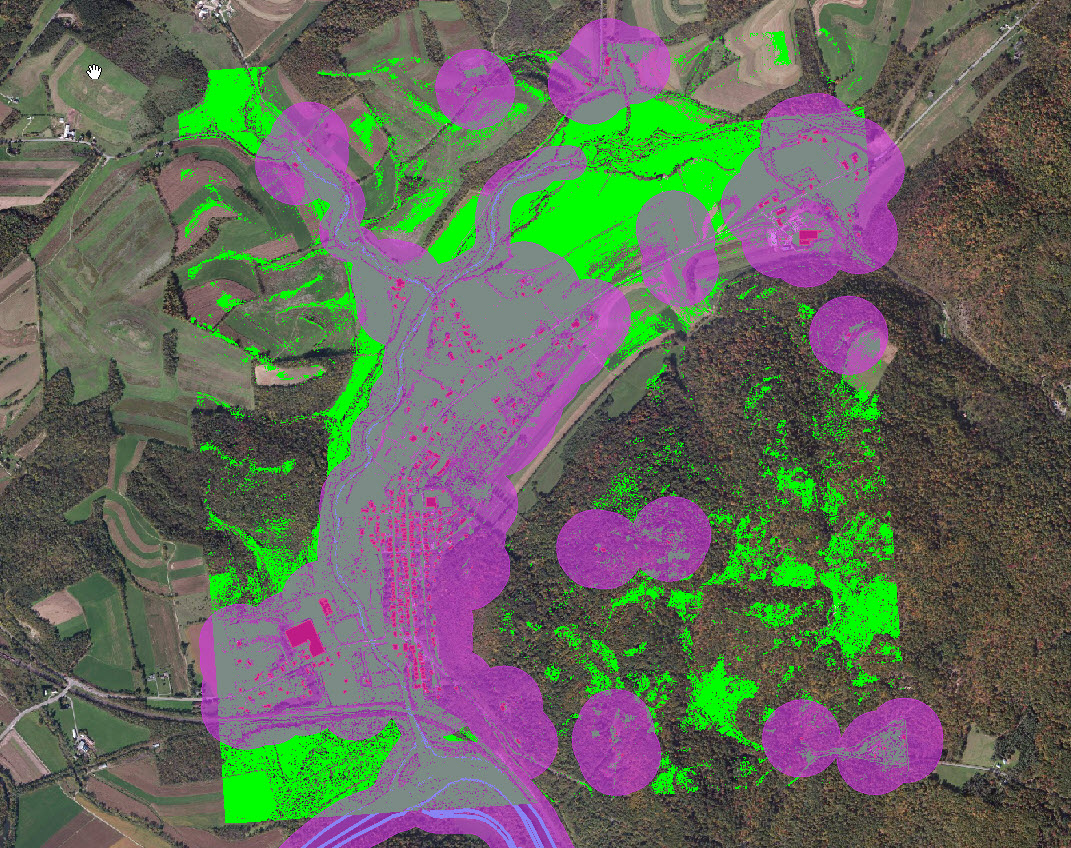
The first step in my process was to identify areas within the scene that were less than or equal to five degrees. This was based on the assumption that a business best practice would be to develop a well site on an area of generally low slope, as opposed to having to level a significant amount of Earth to create a flat surface large enough to place an operation. The next step was to buffer my waterways and buildings so as to adhere to the Pennsylvania State regulations. Remember those numbers I asked you to remember? No drilling within 500 feet of buildings or water wells, within 1,000 feet of water resources used by purveyors, or within 300 feet from streams, springs, wetlands, and other water bodies. Once these buffers were applied to the appropriate vector layers, I am presented with a map that shows in green areas of slope that are 5 degrees or less which do not violate any of the state setback restrictions, which are shown in purple.
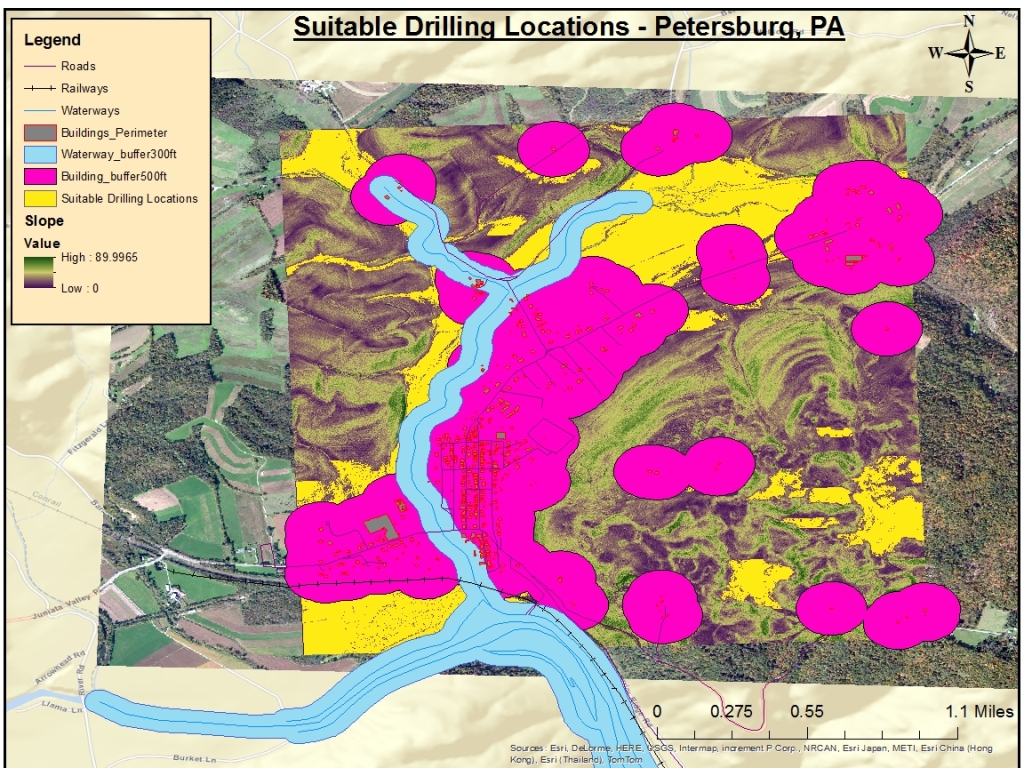
As a final consideration, I looked into the average size of a drill site to ensure I had enough room to place an operation there. According to the Shale Gas Information Platform, the average size of a multi-well pad for the drilling and fracturing phase of operations is 3.5 acres. I used a clump and sieve function in ENVI to remove areas of slope that were not at least 3.5 acres in size. From the final image below, you can see the waterway and building buffers, as well as suitable drilling areas shown in yellow.
This simple case study highlights how geospatial data fusion can help oil and gas drilling operations determine drill site suitability. Regardless of your personal stance on hydraulic fracturing, safe operations that adhere to federal and state regulations is in the best interest of everyone, and geospatial data analysis provides valuable information that can decrease potential risks from these activities. What do you think? Have you used geospatial data to conduct site suitability assessment for oil and gas or other industries? What insights or potential warnings do you have for conducting these types of analyses?