X

NV5 Geospatial Blog

Each month, NV5 Geospatial posts new blog content across a variety of categories. Browse our latest posts below to learn about important geospatial information or use the search bar to find a specific topic or author. Stay informed of the latest blog posts, events, and technologies by joining our email list!


Not All Supernovae Are Created Equal: Rethinking the Universe’s Measuring Tools

Not All Supernovae Are Created Equal: Rethinking the Universe’s Measuring Tools

6/3/2025

Rethinking the Reliability of Type 1a Supernovae   How do astronomers measure the universe? It all starts with distance. From gauging the size of a galaxy to calculating how fast the universe is expanding, measuring cosmic distances is essential to understanding everything in the sky. For nearby stars, astronomers use... Read More >

Using LLMs To Research Remote Sensing Software: Helpful, but Incomplete

Using LLMs To Research Remote Sensing Software: Helpful, but Incomplete

5/26/2025

Whether you’re new to remote sensing or a seasoned expert, there is no doubt that large language models (LLMs) like OpenAI’s ChatGPT or Google’s Gemini can be incredibly useful in many aspects of research. From exploring the electromagnetic spectrum to creating object detection models using the latest deep learning... Read More >

From Image to Insight: How GEOINT Automation Is Changing the Speed of Decision-Making

From Image to Insight: How GEOINT Automation Is Changing the Speed of Decision-Making

4/28/2025

When every second counts, the ability to process geospatial data rapidly and accurately isn’t just helpful, it’s critical. Geospatial Intelligence (GEOINT) has always played a pivotal role in defense, security, and disaster response. But in high-tempo operations, traditional workflows are no longer fast enough. Analysts are... Read More >

Thermal Infrared Echoes: Illuminating the Last Gasp of a Dying Star

Thermal Infrared Echoes: Illuminating the Last Gasp of a Dying Star

4/24/2025

This blog was written by Eli Dwek, Emeritus, NASA Goddard Space Flight Center, Greenbelt, MD and Research Fellow, Center for Astrophysics, Harvard & Smithsonian, Cambridge, MA. It is the fifth blog in a series showcasing our IDL® Fellows program which supports passionate retired IDL users who may need support to continue their work... Read More >

A New Era of Hyperspectral Imaging with ENVI® and Wyvern’s Open Data Program

A New Era of Hyperspectral Imaging with ENVI® and Wyvern’s Open Data Program

2/25/2025

This blog was written in collaboration with Adam O’Connor from Wyvern.   As hyperspectral imaging (HSI) continues to grow in importance, access to high-quality satellite data is key to unlocking new insights in environmental monitoring, agriculture, forestry, mining, security, energy infrastructure management, and more.... Read More >

1345678910Last
26333 Rate this article:
5.0

Looking for Hemp Hotspots

Andrew Fore

The recent passing of the Agriculture and Nutrition Act of 2018 (Farm Bill) includes many important developments for the future of agriculture in the United States. One particularly interesting change is the legalization of Hemp. While there will still be many federal and local limitations on how farmers can grow Hemp, the addition of legal Hemp into the U.S. agriculture market unlocks a new world of opportunity for this versatile plant. Learning more about this change in the U.S. agricultural landscape sparked my curiosity as to how an analysis using ENVI® Crop Science tools would look on a Hemp field. To do this, I decided to run the simple yet useful Find Hotspot tool.

I ran the Find Hotspot tool to look for areas within a Hemp field that are relatively different than the rest of the image. To start the analysis, I used ENVI’s draw ROI tool to create a spatial subset of the image to include only the field’s extent. The next step in the process is to mask out all non-vegetation (soil) pixels in an image. After this is complete, I choose a single band raster for input and entered a distance value for the calculation of local mean values around each pixel. The reason why a distance value is important in finding hotspots is determined by the Getis-Ord Gi* (Getis and Ord, 1992) equation. This equation looks for statistically significant trends or anomalies within a raster on a pixel by pixel basis. Another important step in finding hotspots within a field is using a vegetation index. Using a combination of the broadband greenness vegetation index and color slicing, the vigor and health of the Hemp crops are highlighted.

The resulting image shows variable health across the Hemp field, with the color Red indicating negative values (poor health) and the color Green showing positive values (Healthy). This simple analysis can help agronomists, advisory services or anyone interested in the relative health of a field.

As remote sensing technologies continue to advance, it is important that new crop markets like Hemp utilize the powerful tools available in-order-to maximize yields. Agronomists and advisory services can take advantage of ENVI Crop Science to enhance understanding of crop health and the external factors that influence growth and production. As the Hemp industry expands its acreage and influence, it will be interesting to watch how remote sensing and geospatial tools are used for better crop management.

I encourage anyone who is interested in learning more about our precision agriculture capabilities to check out our Documentation center for more detailed information on ENVI Crop Science tools.

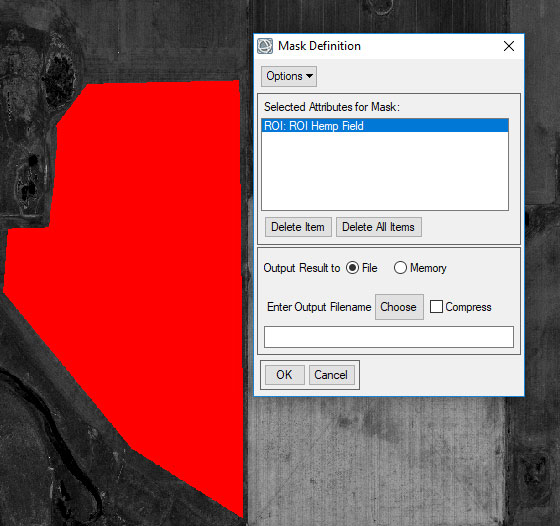
Mask of Hemp Field, Masking can be useful for excluding certain pixels from an image during analysis.

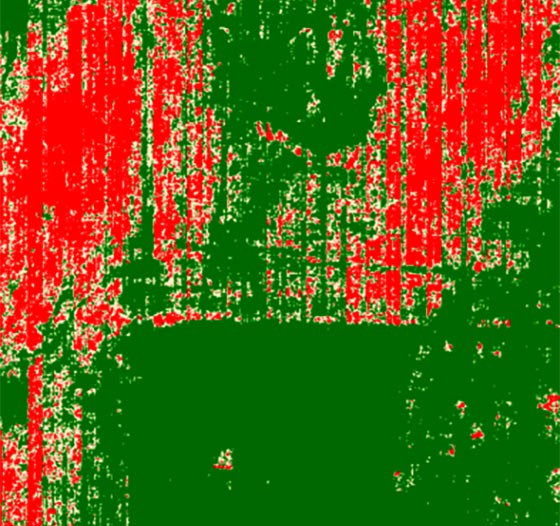
Hotspot results from North American Hemp Field

Please login or register to post comments.