X

NV5 Geospatial Blog

Each month, NV5 Geospatial posts new blog content across a variety of categories. Browse our latest posts below to learn about important geospatial information or use the search bar to find a specific topic or author. Stay informed of the latest blog posts, events, and technologies by joining our email list!


Comparing Amplitude and Coherence Time Series With ICEYE US GTR Data and ENVI SARscape

Comparing Amplitude and Coherence Time Series With ICEYE US GTR Data and ENVI SARscape

12/3/2025

Large commercial SAR satellite constellations have opened a new era for persistent Earth monitoring, giving analysts the ability to move beyond simple two-image comparisons into robust time series analysis. By acquiring SAR data with near-identical geometry every 24 hours, Ground Track Repeat (GTR) missions minimize geometric decorrelation,... Read More >

Empowering D&I Analysts to Maximize the Value of SAR

Empowering D&I Analysts to Maximize the Value of SAR

12/1/2025

Defense and intelligence (D&I) analysts rely on high-resolution imagery with frequent revisit times to effectively monitor operational areas. While optical imagery is valuable, it faces limitations from cloud cover, smoke, and in some cases, infrequent revisit times. These challenges can hinder timely and accurate data collection and... Read More >

Easily Share Workflows With the Analytics Repository

Easily Share Workflows With the Analytics Repository

10/27/2025

With the recent release of ENVI® 6.2 and the Analytics Repository, it’s now easier than ever to create and share image processing workflows across your organization. With that in mind, we wrote this blog to: Introduce the Analytics Repository Describe how you can use ENVI’s interactive workflows to... Read More >

Deploy, Share, Repeat: AI Meets the Analytics Repository

Deploy, Share, Repeat: AI Meets the Analytics Repository

10/13/2025

The upcoming release of ENVI® Deep Learning 4.0 makes it easier than ever to import, deploy, and share AI models, including industry-standard ONNX models, using the integrated Analytics Repository. Whether you're building deep learning models in PyTorch, TensorFlow, or using ENVI’s native model creation tools, ENVI... Read More >

Blazing a trail: SaraniaSat-led Team Shapes the Future of Space-Based Analytics

Blazing a trail: SaraniaSat-led Team Shapes the Future of Space-Based Analytics

10/13/2025

On July 24, 2025, a unique international partnership of SaraniaSat, NV5 Geospatial Software, BruhnBruhn Innovation (BBI), Netnod, and Hewlett Packard Enterprise (HPE) achieved something unprecedented: a true demonstration of cloud-native computing onboard the International Space Station (ISS) (Fig. 1). Figure 1. Hewlett... Read More >

1345678910Last
163998 Rate this article:
3.4

Push Broom and Whisk Broom Sensors

Anonym

We've been doing a lot of cleaning in Boulder this week, after our historic flood. Perhaps not coincidentally, I've been thinking about some cleaning tool terminology commonly used in the remote sensing world. Specifically, I've been thinking about the two types of sensors commonly used for passive, optical, satellite imaging: push broom and whisk broom. As anyone facing any type of complicated task can tell you, it is important to understand your tool. Knowing which type of scanner collected your imagery can help you better understand your data and how to work with it.


Whisk Broom Scanners

Whisk broom scanners, also sometimes referred to as spotlight or across track scanners, use a mirror to reflect light onto a single detector. The mirror moves back and forth, to collect measurements from one pixel in the image at a time ( Fig. 1). The moving parts make this type of sensor expensive and more likely to wear out.

Whisk Broom Sensor

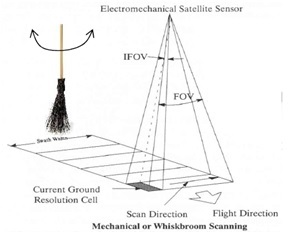
Figure 1. A whisk broom scanner sweeps in a direction perpendicular to the flight path, collecting one pixel at a time. Image courtesy of Florian Hillen.

All Landsat sensors prior to Landsat 8 use the whisk broom design. (The OLI instrument on Landsat 8 uses a pushbroom design.)


Push Broom Scanners

Push broom scanners, also sometimes referred to as along track scanners, use a line of detectors arranged perpendicular to the flight direction of the spacecraft. As the spacecraft flies forward, the image is collected one line at a time, with all of the pixels in a line being measured simultaneously (Fig. 2). A push broom scanner receives a stronger signal than a whisk broom scanner because it looks at each pixel area for longer. One drawback of push broom sensors is that the detectors in the "push broom" can have varying sensitivity. If they are not perfectly calibrated, this can result in stripes in the data.

Push Broom Sensor

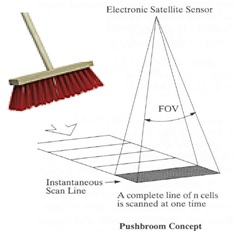
Figure 2. A linear array detector advances with the spacecraft's motion, producing successive lines of image data (analogous to the forward sweep of a push broom). Image courtesy of Florian Hillen.

Sensors that use the push broom design include SPOT, IRS, QuickBird, OrbView, and IKONOS.

2 comments on article "Push Broom and Whisk Broom Sensors"

Avatar image

Sue B.

Not all Landsat sensors use whisk broom technology. Landsat 8 Operational Land Imager (OLI) is a push broom sensor (http://pubs.usgs.gov/fs/2013/3060/pdf/fs2013-3060.pdf)


Avatar image

Peg Shippert

Right you are, Sue. Thank you for calling out my mistake. I've corrected the text.

Please login or register to post comments.