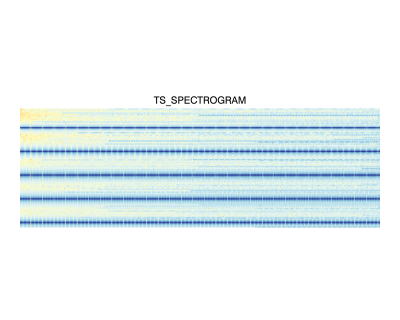
The TS_SPECTROGRAM generates a spectrogram of a given vector.
This routine is written in the IDL language. Its source code can be found in the file TS_SPECTROGRAM.pro in the lib subdirectory of the IDL distribution.
Examples
t = findgen(100000)
data = sin(2*!pi*.02*t) + sin(2*!pi*.12*t) + sin(2*!pi*.22*t) + sin(2*!pi*.32*t) + sin(2*!pi*.42*t)
result = TS_SPECTROGRAM(data, window=512, overlap=128)
i = image(result, RGB_TABLE=colortable(72), title='TS_SPECTROGRAM')
IDL displays:

Syntax
Result = TS_SPECTROGRAM( X [, /DOUBLE] [, FREQ=value] [, SAMPLE_FREQ=value] [, TIME=value] [, OVERLAP=value] [, WINDOW=value] )
Return Value
The result is a [WINDOW/2, 1+(X.length - WINDOW)/OVERLAP] array which describes [time, frequencies].
Arguments
X
An n-element single- or double-precision floating-point vector.
Keywords
DOUBLE
Set this keyword to force the computations to be done in double-precision arithmetic.
FREQ
If set to a named variable, FREQ will contain the frequency vector for the spectrogram.
SAMPLE_FREQ
Set to the sample frequency of the input data.
TIME
If set to a named variable, TIME will contain the time vector for the spectrogram.
OVERLAP
An integer describing the number of points of window overlap. Defaults to WINDOW/2.
Note: OVERLAP is extremely data dependent.
WINDOW
An integer giving the size of the window. Defaults to 1024.
Note: WINDOW is extremely data dependent.
Version History
See Also
SMOOTH, TS_DIFF, TS_FCAST