The IMAGE function displays image data in a graphics window.
See File Formats for a list of supported image types.
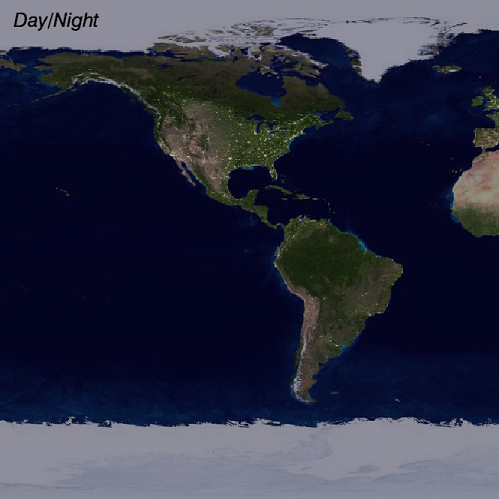
Example
The following lines create the image shown at the top of this topic.
file1 = FILEPATH('Night.jpg', $
SUBDIRECTORY=['examples','data'])
im1 = IMAGE(file1, $
BACKGROUND_COLOR="midnight blue", $
IMAGE_DIMENSIONS=[360,180], $
IMAGE_LOCATION=[-180,-90], $
XRANGE=[-180,0], YRANGE=[-90,90], $
DIMENSIONS=[512,512], MARGIN=0)
file2 = FILEPATH('Day.jpg', $
SUBDIRECTORY=['examples','data'])
im2 = IMAGE(file2, /OVERPLOT, $
IMAGE_DIMENSIONS=[360,180], $
IMAGE_LOCATION=[-180,-90], $
TRANSPARENCY=50)
t = TEXT(-175, 80, '$\it Day/Night$', $
/DATA, FONT_SIZE=20)
for i=-100,100 do im2.TRANSPARENCY=abs(i)
Additional Examples
See Image examples, or Image with a Map Projection, or Viewing an Image.
Syntax
graphic = IMAGE( Data [, X, Y ] [, Keywords=value] [, Properties=value] [, Map Properties=value] [, Map Grid Properties=value] )
graphic = IMAGE( Filename [, Keywords=value] [, Properties=value] [, Map Properties=value] [, Map Grid Properties=value] )
Keywords
Keywords are applied only during the initial creation of the graphic.
AXIS_STYLE=value
/BUFFER, /CURRENT, /DEVICE, DIMENSIONS=[width, height], DRAG_QUALITY=quality, LAYOUT=array, LOCATION=[x, y], MARGIN=scalar or [left, bottom, right, top], /NO_TOOLBAR, /NODATA, /OVERPLOT, /WIDGETS
GEOTIFF=structure, IMAGE_DIMENSIONS=array, IMAGE_LOCATION=array, /IRREGULAR, /ORDER
Properties
Properties can be set as keywords to the function during creation, or retrieved or changed using the "." notation after creation.
ASPECT_RATIO, AXES, BACKGROUND_COLOR, BACKGROUND_TRANSPARENCY, CLIP, CROSSHAIR, FONT_COLOR, FONT_NAME, FONT_SIZE, FONT_STYLE, GRID_UNITS, HIDE, INTERPOLATE, MAPGRID, MAPPROJECTION, MAP_PROJECTION, MAX_VALUE, MIN_VALUE, NAME, POSITION, RGB_TABLE, SCALE_CENTER, SCALE_FACTOR, TITLE, TRANSPARENCY, UVALUE, WINDOW, WINDOW_TITLE, XRANGE, YRANGE, ZVALUE
Methods
Close
ConvertCoord
CopyWindow
Delete
Erase
GenerateCode
GetData
GetValueAtLocation
MapForward
MapInverse
Order
Print
Refresh
Rotate
Save
Scale
Select
SetData
Translate
Return Value
The IMAGE function returns a reference to the created graphic. Use the returned reference to manipulate the graphic after creation by changing properties or calling methods.
Arguments
Data
A filename, vector, two-dimensional array, or a three-dimensional array containing RGB or RGBA pixel values. If Data is three-dimensional, then if any one of the dimensions is 3, it is assumed to represent the red, green, and blue channels. If Data is three-dimensional, then if any one of the dimensions is 4, it is assumed to represent the red, green, blue, and alpha channels.
X
A vector or 2D array containing the x-coordinates of the data.
If Data is a 2D array and X is a vector, then each element of X specifies the x-coordinate for a column of Data.
If X is a two-dimensional array, then each element specifies the x-coordinate of the corresponding point in Data.
Y
A vector or 2D array containing the y-coordinates of the data.
If Data is a 2D array and Y is a vector, then each element of Y specifies the y-coordinate for a row of Data.
If Y is a two-dimensional array, then each element specifies the y-coordinate of the corresponding point in Data.
Automatic Gridding
If Data, X, and Y are vectors with the same number of elements, then the data is assumed to be irregularly spaced. If Data, X, and Y are two-dimensional arrays with the same number of elements, then the X and Y coordinates will be tested to determine if the points are regularly or irregularly spaced.
In either case, if the data are irregularly spaced, then IDL will automatically grid the data so that the points lie on a regular grid. The gridding is done using the following steps:
- IDL calls the QHULL procedure to construct the Delaunay triangulation. If GRID_UNITS="degrees" then the data is assumed to lie on a sphere, and the SPHERE keyword is passed into QHULL.
- The graphics function then constructs an output grid. The number of points in the X and Y dimensions is automatically determined from the average number of points in the original X and Y data. IDL then evenly distributes these points across the corresponding range of the X and Y coordinates.
- IDL calls the GRIDDATA function, using the Delaunay triangulation and the regular grid. For speed, the Natural Neighbor method is used.
- For non-spherical data, we then compare the interpolated data to the minimum and maximum of the original data. Data points are assumed to be "poorly" interpolated if they lie outside of 10% below the minimum or 10% above the maximum of the original data. If more than 10% of the points are poorly interpolated then IDL throws an error and halts execution. Otherwise, IDL passes the bad data points back into GRIDDATA and uses the Linear method, which is slower but more accurate.
Notes
- You can pass in a named variable to the IRREGULAR keyword to determine if automatic gridding was performed.
- You can retrieve the gridded results using the ::GetData method.
- Depending upon the dataset, the automatic gridding may fail or may produce displeasing results. In this case you should do the gridding yourself, perhaps using a different gridding method to GRIDDATA.
Tip: Instead of X and Y, you can also use the IMAGE_DIMENSIONS and IMAGE_LOCATION properties to define the image grid.
Keywords
AXIS_STYLE
Set this keyword to one of the following values:
- 0 - No axes. Decrease the margins so the graphic almost fills the window. This is the default for images.
- 1 - Single X, Y (and Z if 3D) axes located at the minimum data value. The margins will be adjusted to leave space for the axes. This is the default for 3D graphics.
- 2 - Box axes - multiple axes located at both the minimum and maximum data values. The margins will be adjusted to leave space for the axes. This is the default for 2D graphics.
- 3 - Crosshair-style axes - located at the midpoint of each data dimension. Since the axes are in the middle, decrease the margins so the graphic almost fills the window. This is the default for polar plots.
- 4 - No axes, but use the same margins as if axes were there. This is useful if you want to later add another graphic that does have axes, and you want the two visualizations to be aligned properly.
You can set the following properties on the axes:
|
Property |
Description |
|
[XYZ]COLOR |
A string or RGB vector containing the axis color.
|
|
[XYZ]GRIDSTYLE |
A string, integer, or 2-element vector giving the linestyle for tickmarks.
|
|
[XYZ]LOG |
Set to 1 if the axis is logarithmic. The minimum value of the axis range must be greater than zero.
|
|
[XYZ]MAJOR |
The number of major tick marks. Set to -1 to auto-compute, set to 0 to suppress.
|
|
[XYZ]MINOR |
The number of minor tick marks. Set to -1 to auto-compute, set to 0 to suppress.
|
|
[XYZ]SUBGRIDSTYLE
|
A string, integer, or 2-element vector giving the linestyle for the minor tickmarks. The default is 0, for solid lines. Set to -1 to force minor ticks to have the same linestyle as major ticks.
|
|
[XYZ]SHOWTEXT |
Set to 1 to show text labels or 0 to hide the text labels.
|
|
[XYZ]STYLE |
The axis range style. The valid values are:
(0) Nice range. Default for all graphics except Image, Barplot, and Map.
(1) Force the exact data range. Default for Image, Barplot, and Map.
(2) Pad the axes slightly beyond the nice range.
(3) Pad the axes slightly beyond the exact data range.
The [XYZ]RANGE takes precedence over this property.
|
|
[XYZ]SUBTICKLEN |
The ratio of the minor tick length to the major tick length. The default is 0.5.
|
|
[XYZ]TEXT_COLOR |
A string or RGB vector containing the axis text color.
|
|
[XYZ]TEXT_ORIENTATION
|
The angle (in degrees) of the tick mark labels.
|
|
[XYZ]TEXTPOS |
Set to 1 to position text above the axis. The default is 0, below the axis.
|
|
[XYZ]THICK |
Set to a floating-point value between 0 and 10 to specify the line thickness for tickmarks. A thickness of 0 gives a thin hairline. The default is 1.
|
|
[XYZ]TICKDIR |
Set to 1 to draw the tickmarks facing outwards. The default is 0, facing inwards.
|
|
[XYZ]TICKFONT_NAME
|
A string containing the font name for the axis text.
|
|
[XYZ]TICKFONT_SIZE
|
The axis text size in points.
|
|
[XYZ]TICKFONT_STYLE
|
A string or integer containing the font style: normal (0), bold (1), italic (2), or bold italic (3).
|
|
[XYZ]TICKFORMAT |
A string or string array of tick label formats. See Format Codes for more information.
|
|
[XYZ]TICKINTERVAL
|
The interval between major tick marks.
|
|
[XYZ]TICKLAYOUT |
Set to 1 to suppress tick marks; set to 2 to draw a box around the tick labels.
|
|
[XYZ]TICKLEN |
The length of each major tick mark, normalized to the width or height of the graphic. The default value is automatically calculated based upon the aspect ratio of the graphic.
|
|
[XYZ]TICKNAME |
A string array containing the tick labels.
|
|
[XYZ]TICKUNITS |
A string giving the tick units. Valid values are: null (the default, signified by empty quotes), Years, Months, Days, Hours, Minutes, Seconds, Time, exponent for exponential notation, or scientific for scientific notation.
If any of the time units are utilized, then the tick values are interpreted as Julian date/time values. If more than one unit is provided, the axis will be drawn with multiple levels.
|
|
[XYZ]TICKVALUES |
An array of tick mark locations.
|
|
[XYZ]TITLE |
A string giving the axis title.
|
|
[XYZ]TRANSPARENCY
|
An integer from 0-100 giving the percent transparency.
|
For more detailed explanations of these properties, see the AXIS function.
Tip: You can also use the AXIS function to insert additional axes after the graphic has been created.
BUFFER
Set this keyword to 1 to direct the graphics to an off-screen buffer instead of creating a window.
CURRENT
Set this keyword to create the graphic in the current window with a new set of axes. If no window exists, a new window is created. The WINDOW's SetCurrent method may be used to set the current window.
Or, set this keyword to an existing IDL Graphic reference to make that window be the current window and direct the new graphic to that window.
Tip: The CURRENT keyword is usually used with the LAYOUT keyword or POSITION property to produce a window which has multiple graphics in different locations.
Tip: For the graphic share the same axes as an existing graphic, use the OVERPLOT keyword instead.
DEVICE
Set this keyword if values are specified in device coordinates (pixels) for the MARGIN and POSITION keywords. (Normalized coordinates are the default for these keywords.)
DIMENSIONS
Set this keyword to a two-element vector of the form [width, height] to specify the window dimensions in pixels. If you do not specify a value for DIMENSIONS, IDL by default uses the values of the IDL_GR_WIN_HEIGHT and IDL_GR_WIN_WIDTH preferences for Windows platforms or the IDL_GR_X_HEIGHT and IDL_GR_X_WIDTH preferences for X Windows systems on UNIX.
Tip: The minimum width is set by the toolbar in the window, usually around 400 pixels. To create a smaller graphics window, use the NO_TOOLBAR keyword.
DRAG_QUALITY
Set this keyword to 0, 1, or 2 to control the rendering quality and performance during moves, transformations, and rotations initiated with the mouse. The default value is 2, which maintains full rendering quality during mouse interactions. Set to 1 to reduce the drawing quality, or to 0 to further reduce or in some cases disable drawing during dragging or resizing.
LAYOUT
Set this keyword to a three-element vector [ncol, nrow, index] that arranges graphics in a grid. The first dimension ncol is the number of columns in the grid, nrow is the number of rows, and index is the grid position at which to place the graphic (starting at element 1). This keyword is ignored if either OVERPLOT or POSITION is specified.
LOCATION
Set this keyword to a two-element vector [X offset, Y offset] giving the window's screen offset in pixels.
MARGIN
Set this keyword to the current graphic’s margin values in the layout specified by the LAYOUT property. Use a scalar value to set the same margin on all sides, or use a four-element vector [left, bottom, right, top] to specify different margins on each side.
By default, margin values are expressed in normalized units ranging from 0.0 to 0.5. If the DEVICE keyword is set, the values are given in device units (pixels).
This keyword is ignored if either OVERPLOT or POSITION is specified.
NO_TOOLBAR
By default the graphics window will have a toolbar containing some common tools such as Print and Save. Set this keyword to remove the toolbar. This keyword has no effect if the window is already created.
Tip: When the toolbar exists, the minimum window width is set to the toolbar's width, usually around 400 pixels. To create a smaller graphics window, use the NO_TOOLBAR keyword.
NODATA
Set this keyword to 1 to create the graphic, but without any data attached to it. The axes and title (if present) are also created and displayed. If the OVERPLOT keyword is specified, axis ranges will not change.
Note: You must still provide valid input arguments. The data range of the input arguments are used to automatically set the range of the axes. The [XYZ]RANGE properties may be used to override these default ranges.
OVERPLOT
Set this keyword to 1 (one) to place the graphic on top of the currently-selected graphic within the current window. The two graphics items will then share the same set of axes. If no current window exists, then this keyword is ignored and a new window is created.
If you have a graphic in another window that is not currently selected, you can also set this keyword to that graphic's reference to overplot on top of that graphic.
Tip: For the graphic to have a new set of axes, use the CURRENT keyword instead.
WIDGETS
By default, when running from the IDL Workbench, the graphics window will use the native widgets for your platform. Set this keyword to instead use IDL widgets for the graphics window. This keyword is ignored when running from the IDL command line, since IDL widgets are always used in that case.
GEOTIFF
Set this keyword equal to an anonymous structure containing the GeoTIFF tags from a GeoTIFF file. For information on GeoTIFF tags, see the GEOTIFF keyword in the READ_TIFF function.
IMAGE_DIMENSIONS
Set this keyword to a 2-element vector, [width, height], to specify the image dimensions (in data units). By default, the dimensions equal the number of columns and rows in the image. If this property is set then the X and Y arguments are ignored.
Note: If GRID_UNITS is in "degrees" then IMAGE_DIMENSIONS should be set to the width and height of the image, in degrees, on the Earth's surface. If GRID_UNITS is in "meters" then IMAGE_DIMENSIONS should be set to the width and height of the image in meters. In this case, set the MAP_PROJECTION property to specify the actual map projection associated with the image.
IMAGE_LOCATION
Set this keyword to a 2-element vector, [x, y], to specify the location of the lower-left pixel in data units. By default, the location is [0, 0]. If this property is set then the X and Y arguments are ignored.
Note: If GRID_UNITS is in "degrees" then IMAGE_LOCATION should be set to the latitude and longitude of the lower-left corner of the image. If GRID_UNITS is in "meters," then IMAGE_LOCATION should be set to the X offset and Y offset of the lower-left corner of the image within the image's map projection. In this case, set the MAP_PROJECTION property to specify the actual map projection associated with the image.
IRREGULAR
Set this keyword to 1 to force the data to be gridded onto a regular grid. Set this keyword to 0 to disable automatic gridding. By default, if this keyword is not specified, then IDL will automatically grid the data if the X and Y locations are not on a 2D evenly-spaced grid.
ORDER
Set this keyword to force the rows of the image data to be drawn from top to bottom. By default, image data is drawn from the bottom row up to the top row.
Properties
ASPECT_RATIO
A floating point value indicating the ratio of the Y dimension to the X dimension in data units. If this property is set to a nonzero value, the aspect ratio will be preserved as the graphic is stretched or shrunk. The default value is 0 for all graphics except images, meaning that the aspect ratio is not fixed, but is allowed to change as the graphic is stretched or shrunk.
AXES (Get Only)
This property retrieves an array that contains all of the AXIS objects within the visualization. For example, for a plot visualization:
p = PLOT(/TEST)
ax = p.AXES
ax[0].TITLE = 'X axis'
ax[1].TITLE = 'Y axis'
ax[2].HIDE = 1
ax[3].HIDE = 1
See AXIS for a list of the available properties.
BACKGROUND_COLOR
Set this property to a string or RGB vector indicating the graphic's background color. The default value is [255, 255, 255] (white). Set this property to a scalar value to remove the background color.
Tip: To set the background color of the entire window, retrieve the window object using the WINDOW property, and set the BACKGROUND_COLOR on the window object.
BACKGROUND_TRANSPARENCY
Set this property to an integer between 0 and 100 giving the percent transparency of the background color. The default is 100 (completely transparent).
Note: If the BACKGROUND_COLOR property is changed, and the current background transparency is 100, then the BACKGROUND_TRANSPARENCY will be automatically set to 0 (opaque) so that you can see the new color.
CLIP
Set this property to 1 to clip portions of the graphic that lie outside of the dataspace range, or to 0 to disable clipping. The default is 1.
CROSSHAIR (Get Only)
Use this property to retrieve a reference to the Crosshair graphic. All graphics objects within the same set of axes share a single Crosshair graphic. For Plot graphics the default behavior is to display the crosshair when a Mouse_Down event is received. For other graphics the crosshair is disabled. The STYLE property may be used to automatically draw the crosshair, while the LOCATION property may be used to manually draw the crosshair.
You can get and set the following properties on the retrieved crosshair:
|
Property |
Description |
|
ANTIALIAS |
Set to 1 to enable anti-aliasing for the lines.
|
|
COLOR |
A string or RGB vector containing the color.
|
|
HIDE |
Set to 1 to hide the crosshair, 0 to show.
|
|
INTERPOLATE |
Set to 1 to force interpolation between Plot data points when SNAP is active. For other graphics this property is ignored. The default is 0.
|
|
LINESTYLE |
An integer or string giving the line style. The default is 'dot'. See Linestyle Values for additional options.
|
|
LOCATION |
The location at which to draw the crosshair. For Plot graphics, if SNAP is enabled, then only the X coordinate needs to be supplied. Otherwise, LOCATION should be set to a two-element vector [X, Y] for two-dimensional graphics or [X, Y, Z] for three-dimensional graphics. If STYLE is currently "None", then setting the LOCATION will automatically set the STYLE to "Manual".
|
|
NAME |
The name of the graphic.
|
|
SNAP |
Set to 1 to snap the crosshair to the nearest Plot data point. For other graphics this property is ignored. The default is 1.
|
|
STYLE |
An integer or string giving the crosshair style. Possible values are:
0 - "None" - never draw the crosshair. This is the default for all graphics except 2D plots.
1 - "Manual" - draw the crosshair using the LOCATION property.
2 - "Auto" - automatically draw the crosshair. This is the default for 2D plots.
|
|
THICK |
The thickness of the lines. The default is 1.
|
|
TRANSPARENCY |
The percent transparency of the lines. The default is 50.
|
|
UVALUE |
An IDL variable of any data type.
|
For example, use the CROSSHAIR property to draw a crosshair on an image:
im = IMAGE(/TEST, TRANSPARENCY=50, AXIS_STYLE=2)
c = im.CROSSHAIR
c.COLOR = 'red'
c.THICK = 2
c.LOCATION = [300, 200]
See Creating Functions to Control Mouse Events for a more detailed crosshair example.
FONT_COLOR
Set this property to a string or RGB vector that specifies the text color for the title and axes (if present). The default value is "black".
FONT_NAME
Set this property equal to a string specifying the IDL or system font for the title and axes (if present). The default value is "DejaVuSans".
FONT_SIZE
Set this property equal to an integer specifying the font size for the title and axes (if present). The default value is 9 points for the axis text and 11 points for the title.
FONT_STYLE
Set this property equal to an integer or a string specifying the font style for the title and axes (if present). Allowed values are:
|
Integer |
String |
Resulting Style |
|
0 |
"Normal" or "rm"
|
Default (roman) |
|
1 |
"Bold" or "bf" |
Bold |
|
2 |
"Italic" or "it"
|
Italic |
|
3 |
"Bold italic" or "bi"
|
Bold italic |
GRID_UNITS
Set this property to a string or integer specifying the units for the image grid. This property applies only when a map projection is inserted. It has the following possible values:
-
0 or "" - None. The image grid is in arbitrary units that are not tied to a map projection. The image will not be warped to the current map projection.
-
1 or "m" or "meters" - Meters. The image grid is in meters, and is tied to a particular map projection. The image will be warped to the current map projection.
-
2 or "deg" or "degrees" - Degrees. The image grid is in degrees longitude/latitude, and will be automatically warped to the current map projection.
HIDE
Set this property to 1 to hide the graphic. Set HIDE to 0 to show the graphic.
INTERPOLATE
Set this property to 1 to display the image using bilinear interpolation. The default is to use nearest-neighbor interpolation.
MAPGRID (Get Only)
If a map projection is currently in effect, this property retrieves a reference to the MAPGRID object.
MAPPROJECTION (Get Only)
If a map projection is currently in effect, this property retrieves a reference to the MAPPROJECTION object.
MAP_PROJECTION
A string giving the name of the map projection associated with this image. After creation, use this property to retrieve or set the current map projection. See below for a list of available map projections, projection properties, or grid properties.
Note: If you set the MAP_PROJECTION property, you should also set the GRID_UNITS property to either "degrees" or "meters". You should also set the IMAGE_DIMENSIONS and IMAGE_LOCATION keywords as necessary.
If the image has GRID_UNITS in "degrees" (latitude and longitude), then IDL will use the specified map projection to set the projection for the entire dataspace. IDL will warp the image from degrees to meters and overlaid onto the map projection.
If the image's GRID_UNITS are "meters," IDL assumes the image is already projected into the specified map projection. In this case, use the IMAGE_DIMENSIONS and IMAGE_LOCATION properties to register the image at the correct map location. If you are placing this image into a new graphic dataspace, or the existing dataspace does not have a map projection, then IDL will apply the image's map projection to that dataspace. Finally, if the image's map projection matches the dataspace's map projection, IDL will overlay the image directly onto the map with no warping. If, however, the image's map projection does not match the projection of the current dataspace, IDL will warp the image from its projection to the dataspace's map projection.
MAX_VALUE
A scalar or array giving the maximum image data value to be used when displaying the image. For byte data the default is 255. For other data types the default is the maximum data value for each band. If a scalar value is provided then the same value is used for all bands in the image. If an array is provided, it should have three elements for an RGB image, or four elements for an RGBA image.
MIN_VALUE
A scalar or array giving the minimum image data value to be used when displaying the image. For byte data the default is 0. For other data types the default is the minimum data value for each band. If a scalar value is provided then the same value is used for all bands in the image. If an array is provided, it should have three elements for an RGB image, or four elements for an RGBA image.
Tip: If you have a byte image that does not span the entire 0-255 range, you could set the MIN_VALUE and MAX_VALUE properties to the minimum and maximum data value to stretch the data to fill the 0-255 range. Or, instead, you could set the RGB_TABLE to a color table that only contains colors that span your data values.
NAME
A string that specifies the name of the graphic. The name can be used to retrieve the graphic using the brackets array notation. If NAME is not set then a default name is chosen based on the graphic type.
POSITION
Set this property to a four-element vector that determines the position of the graphic within the window. The coordinates [X1, Y1, X2, Y2] define the lower left and upper right corners of the graphic. Coordinates are expressed in normalized units ranging from 0.0 to 1.0. On creation, if the DEVICE keyword is set, the units are given in device units (pixels).
Note: After creation, you can set the POSITION to either a two or four-element vector. If two elements are provided, the center of the graphic will be translated to that position. If four elements are provided, the graphics will be translated and scaled to fit the position.
RGB_TABLE
The number of the predefined IDL color table, or a 3 x N or N x 3 byte array (where N <= 256) containing color values to use for two-dimensional indexed-color image data. You can also set the RGB_TABLE to a string array of !COLOR color names, and IDL will automatically retrieve the RGB values using the COLORTABLE function. If the data is a true color image (RGB or RGBA) then this property is ignored.
Tip: If you have a byte image that does not span the entire 0-255 range, you can set the RGB_TABLE to either a string array of color names, or a table that only contains colors that span your data values. For example:
img = READ_TIFF(FILEPATH('image.tif', SUBDIR=['examples','data']))
i = IMAGE(BYTSCL(img, TOP=3), RGB_TABLE=['light blue', 'green', 'red', 'white'])
SCALE_CENTER
This property repositions the image inside of the graphics window. Set SCALE_CENTER to a two-dimensional array of image coordinates (in pixels) to be reset to the center of the graphic window. For example, if your image is 512 pixels x 512 pixels and its default center is (256,256), setting SCALE_CENTER=[100,100] resets pixel location (100,100) to be at the center of the graphic window. This has the effect of moving your image up and to the right of its default location.
Note: If you specify pixel coordinates beyond the range of your image, you may lose the image from the graphic window. If you do not know the pixel coordinates of the image's original center location, use the "Reset Axis Range" button on your graphic window to set your image back to its default.
SCALE_FACTOR
Set this property to a scalar value indicating the scale of the image in relation to its graphics window (image:window). For example,
- SCALE_FACTOR=1 indicates that the image displays 1:1 in relation to the graphics window.
- SCALE_FACTOR=.5 means IDL displays the image in a ratio of .5:1 (or 1:2).
- SCALE_FACTOR=2 tells IDL to display the image 2:1.
TITLE
Set this property to a string specifying a title. If TITLE is specified, you can also specify any of the FONT_COLOR, FONT_NAME, FONT_SIZE, and FONT_STYLE properties to control the title appearance.
After creation the TITLE property may be used to retrieve a reference to the title text object, and the TEXT properties may be used to modify the title object.
You can add Greek letters and mathematical symbols using a TeX-like syntax, enclosed within a pair of "$" characters. See Adding Mathematical Symbols and Greek Letters to the Text String for details.
TRANSPARENCY
An integer between 0 and 100 that specifies the percent transparency of the image. The default value is 0.
UVALUE
Set this property to an IDL variable of any data type.
WINDOW (Get Only)
This property retrieves a reference to the WINDOW object which contains the graphic.
WINDOW_TITLE
Set this property to the title of the IDL Graphic window. The title is displayed in the window's title bar.
XRANGE
A two-element vector giving the X data range to plot. The default behavior is to plot the entire data range.
YRANGE
A two-element vector giving the Y data range to plot. The default behavior is to plot the entire data range.
ZVALUE
Set this property to the height of the Z plane onto which the image will be projected. The default is 0.
Map Projections
You can use the following map projections with the MAP_PROJECTION property:
|
Alaska Conformal
Albers Equal Area
Azimuthal Equidistant
Cylindrical Equal Area
Equidistant Conic
Equirectangular
Geographic
Gnomonic
GOES-R |
Hammer
Hotine Oblique Mercator
Integerized Sinusoidal
Interrupted Goode
Interrupted Mollweide
Lambert Azimuthal
Lambert Conformal Conic
Mercator
Miller Cylindrical
|
Mollweide
Near Side Perspective
Oblated Equal Area
Orthographic
Polar Stereographic
Polyconic
Robinson
Sinusoidal |
Space Oblique Mercator
State Plane
Stereographic
Transverse Mercator
UTM
Van der Grinten
Wagner IV
Wagner VII |
See the Map function for a description of the map projections.
Map Properties
If you use the MAP_PROJECTION property to set the map projection, then you may need to set other properties to define the projection. The following properties may be set:
|
CENTER_LATITUDE
CENTER_LONGITUDE
ELLIPSOID
FALSE_EASTING
FALSE_NORTHING
HEIGHT
HOM_AZIM_ANGLE
HOM_AZIM_LONGITUDE
HOM_LATITUDE1 |
HOM_LATITUDE2
HOM_LONGITUDE1
HOM_LONGITUDE2
IS_JUSTIFY
IS_ZONES
LIMIT
MERCATOR_SCALE
OEA_ANGLE
OEA_SHAPEM |
OEA_SHAPEN
SEMIMAJOR_AXIS
SEMIMINOR_AXIS
SOM_FLAG
SOM_INCLINATION
SOM_LANDSAT_NUMBER
SOM_LANDSAT_PATH
SOM_LONGITUDE |
SOM_PERIOD
SOM_RATIO
SPHERE_RADIUS
STANDARD_PAR1
STANDARD_PAR2
STANDARD_PARALLEL
TRUE_SCALE_LATITUDE
ZONE |
To set these properties after creation, you can use the MAPPROJECTION property to retrieve a reference to the MapProjection object, and then set the properties on that object. See MAP_PROJ_INIT for a description of these properties.
Map Grid Properties
The following map graticule (grid) properties are available on creation:
|
BOX_ANTIALIAS
BOX_AXES
BOX_COLOR
BOX_THICK
CLIP COLOR
FILL_COLOR
FONT_NAME
FONT_SIZE |
FONT_STYLE
GRID_LATITUDE
GRID_LONGITUDE
HIDE
HORIZON_COLOR
HORIZON_LINESTYLE
HORIZON_THICK
LABEL_ALIGN |
LABEL_ANGLE
LABEL_COLOR
LABEL_FILL_BACKGROUND
LABEL_FILL_COLOR
LABEL_FORMAT
LABEL_POSITION
LABEL_SHOW
LABEL_VALIGN |
LATITUDE_MAX
LATITUDE_MIN
LINESTYLE
LONGITUDE_MAX
LONGITUDE_MIN
THICK
TRANSPARENCY
ZVALUE |
To get or set a property after creation, you can use the MAPGRID property to retrieve a reference to the MapGrid, and then get or set properties directly on that object. See the MAPGRID function for a description of these properties.
Version History
|
8.0 |
Introduced |
|
8.1 |
Added the following properties: CROSSHAIR, GEOTIFF, MAP_PROJECTION, MAPGRID, MAPPROJECTION, UVALUE, [XYZ]SHOWTEXT, [XYZ]STYLE,
Added the following methods: Delete, GetData, GetValueAtLocation, MapForward, MapInverse, SetData.
|
|
8.2 |
Added AXES, BACKGROUND_COLOR, BACKGROUND_TRANSPARENCY, CLIP properties.
|
|
8.2.1 |
[XYZ]TICKUNITS accepts exponent as a value.
|
|
8.2.2 |
Change POSITION from a keyword to a property.
Change MIN_VALUE and MAX_VALUE to be the min/max data values per band.
Add table of map projection and map grid properties.
|
|
8.2.3 |
Added automatic gridding of irregularly-spaced data, and the IRREGULAR keyword. Added SCALE_FACTOR and SCALE_CENTER properties.
|
|
8.3 |
For RGB_TABLE allow a string array of color names.
|
| 8.6 |
Changed default font name and font size. |
|
8.6.1 |
Added ellipsoid support to Near Side Perspective projection. |
See Also
!COLOR, File Formats, Formatting IDL Graphics Symbols and Lines, PLOT, WINDOW, Viewing an Image, Using IDL graphics