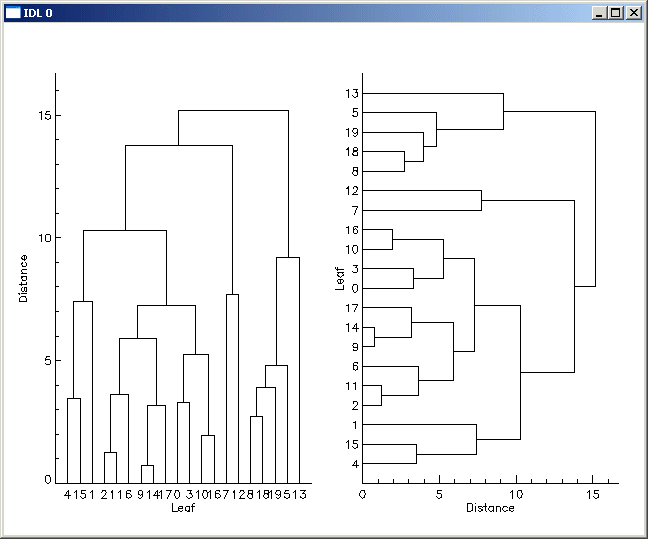
Given a hierarchical tree cluster, usually created by the CLUSTER_TREE function, the DENDRO_PLOT procedure draws a two-dimensional dendrite plot on the current direct graphics device.
This routine is written in the IDL language. Its source code can be found in the file dendro_plot.pro in the lib subdirectory of the IDL distribution.
Example
m = 20
data = 7*RANDOMN(-1, 2, m)
distance = DISTANCE_MEASURE(data)
clusters = CLUSTER_TREE(distance, linkdistance, LINKAGE = 2)
DENDRO_PLOT, clusters, linkdistance, $
POSITION = [0.08, 0.1, 0.48, 0.9], $
XSTYLE = 9, YSTYLE = 9, $
XTITLE = 'Leaf', YTITLE = 'Distance'
DENDRO_PLOT, clusters, linkdistance, $
ORIENTATION = 1, /NOERASE, $
POSITION=[0.56, 0.1, 0.96, 0.9], $
XSTYLE = 9, YSTYLE = 9, $
XTITLE = 'Distance', YTITLE = 'Leaf'

Syntax
DENDRO_PLOT, Clusters, Linkdistance [, LABEL_CHARSIZE=value] [, LABEL_CHARTHICK=value] [, LABEL_COLOR=value] [, LABEL_NAMES=vector] [, LABEL_ORIENTATION=value] [, LINECOLOR=value] [, ORIENTATION={1|2|3|4}] [, /OVERPLOT]
Graphics Keywords:[, BACKGROUND=color_index] [, CHARSIZE=value] [, CHARTHICK=integer] [, CLIP=[X0, Y0, X1, Y1]] [, COLOR=value] [, /DATA| , /DEVICE| , /NORMAL] [, FONT=integer] [, LINESTYLE={0 | 1 | 2 | 3 | 4 | 5}] [, /NOCLIP] [, /NODATA] [, /NOERASE] [, POSITION=[X0, Y0, X1, Y1]] [, PSYM=integer{0 to 10}] [, SUBTITLE=string] [, SYMSIZE=value] [, /T3D] [, THICK=value] [, TICKLEN=value] [, TITLE=string]
[, {X | Y | Z} CHARSIZE=value]
[, {X | Y | Z} GRIDSTYLE=integer{0 to 5}]
[, {X | Y | Z}MARGIN=[left, right]]
[, {X | Y | Z}MINOR=integer]
[, {X | Y | Z}RANGE=[min, max]]
[, {X | Y | Z}STYLE=value]
[, {X | Y | Z}THICK=value]
[, {X | Y | Z}TICK_GET=variable]
[, {X | Y | Z}TICKFORMAT=string]
[, {X | Y | Z}TICKINTERVAL= value]
[, {X | Y | Z}TICKLAYOUT=scalar]
[, {X | Y| Z}TICKLEN=value]
[, {X | Y | Z}TICKNAME=string_array]
[, {X | Y | Z}TICKS=integer]
[, {X | Y| Z}TICKUNITS=string]
[, {X | Y | Z}TICKV=array]
[, {X | Y | Z}TITLE=string]
[, ZVALUE=value{0 to 1}]
Arguments
Clusters
A 2-by-(m-1) input array containing the cluster indices, where m is the number of items in the original dataset. This array is usually the result of the CLUSTER_TREE function.
Linkdistance
An (m-1)-element input vector containing the distances between cluster items, as returned by the Linkdistance argument to the CLUSTER_TREE function.
Keywords
LABEL_CHARSIZE
The overall character size for the leaf labels when Hershey or TrueType fonts are selected. This keyword does not apply when hardware fonts are selected. If this keyword is omitted, then the value of the CHARSIZE keyword is used.
LABEL_CHARTHICK
An integer value specifying the line thickness of the vector drawn font characters for the leaf labels.This keyword has no effect when used with the hardware drawn fonts. If this keyword is omitted, then the value of the CHARTHICK keyword is used.
LABEL_COLOR
The color index of the leaf labels. If this keyword is omitted, then the value of the COLOR keyword is used.
LABEL_NAMES
Set this keyword to an m-element string array containing the leaf labels. If this keyword is omitted then leaves are labelled using integers 0…m-1. If this keyword is set to a scalar value then the leaf labels are not drawn.
Note: The LABEL_NAMES should be input in their original order, corresponding to the m items of the original dataset. DENDRO_PLOT will automatically rearrange the labels to match the order of the leaf nodes in the dendrogram.
LABEL_ORIENTATION
Specifies the counterclockwise angle in degrees from horizontal of the text baseline for the leaf labels. If this keyword is omitted then labels are drawn horizontally, unless ORIENTATION=0 or 2, in which case the labels are drawn vertically if the largest label has more than two characters.
LINECOLOR
The color index of the dendrite lines. If this keyword is omitted, then the value of the COLOR keyword is used.
ORIENTATION
Set this keyword to an integer giving the orientation of the dendrite plot. Possible values are:
|
Value |
Orientation |
|
0 |
(Default): Bottom-to-top. Leaf nodes are drawn at the bottom.
|
|
1 |
Left-to-right. Leaf nodes are drawn at the left.
|
|
2 |
Top-to-bottom. Leaf nodes are drawn at the top.
|
|
3 |
Right-to-left. Leaf nodes are drawn at the right.
|
Note: For ORIENTATION=0 or 2, the XRANGE, XTICKLEN, XTICKS, XTICKV, and XTICKNAME keywords are ignored. For ORIENTATION=1 or 3, the YRANGE, YTICKLEN, YTICKS, YTICKV, and YTICKNAME keywords are ignored.
OVERPLOT
Set this keyword to avoid creating a new dendrite plot and axes. Instead, the dendrogram lines and leaf labels are drawn on the existing plot window.
Note: If OVERPLOT is specified, then for ORIENTATION = 0 or 2, most keywords which affect the Y axis are ignored. Conversely, for ORIENTATION = 1 or 3, most keywords which affect the X axis are ignored.
Note: For the dendrite plot the default values for XSTYLE and YSTYLE are 1.
Version History
See Also
CLUSTER_TREE, DENDROGRAM, DISTANCE_MEASURE