The FV_TEST function computes the F-statistic and the probability that two sample populations X and Y have significantly different variances. X and Y may be of different lengths. The F-statistic formula for sample populations x and y with means x and y is defined as:
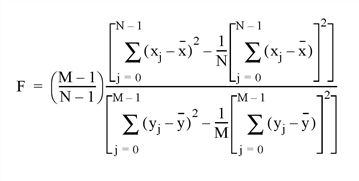
where x = (x0, x1, x2, ..., xN-1) and y = (y0, y1, y2 ..., yM-1)
This routine is written in the IDL language. Its source code can be found in the file fv_test.pro in the lib subdirectory of the IDL distribution.
Examples
X = [257, 208, 296, 324, 240, 246, 267, 311, 324, 323, 263, $
305, 270, 260, 251, 275, 288, 242, 304, 267]
Y = [201, 56, 185, 221, 165, 161, 182, 239, 278, 243, 197, $
271, 214, 216, 175, 192, 208, 150, 281, 196]
PRINT, FV_TEST(X, Y)
IDL prints:
2.48578 0.0540116
The result indicates that X and Y have significantly different variances.
Syntax
Result = FV_TEST(X, Y)
Return Value
The result is a two-element vector containing the F-statistic and its significance. The significance is a value in the interval [0.0, 1.0]; a small value (0.05 or 0.01) indicates that X and Y have significantly different variances. This type of test is often referred to as the F-variance test.
Arguments
X
An n-element integer, single- or double-precision floating-point vector.
Y
An m-element integer, single- or double-precision floating-point vector.
Keywords
None.
Version History
See Also
KW_TEST, MOMENT, RS_TEST, S_TEST, TM_TEST