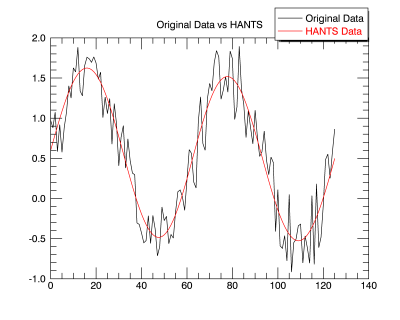
The TS_HANTS (Harmonic ANalysis of Time Series) function can be used to smooth noisy data or interpolate data to reconstruct incomplete images. This is accomplished by calculating a Fourier series to the data while filtering/replacing outliers with values determined by the Fourier transform.
This routine is written in the IDL language. Its source code can be found in the file TS_HANTS.pro in the lib subdirectory of the IDL distribution.
Examples
range = [0:4*!pi:.1]
data = SIN(range) + RANDOMU(seed, range.length)
hants = TS_HANTS(data)
pd = PLOT( data, NAME = 'Original Data' )
ph = PLOT( hants, 'r', NAME = 'HANTS Data', /OVERPLOT )
l = LEGEND( TARGET = [pd,ph], /AUTO_TEXT_COLOR )
IDL plots:

Syntax
Result = TS_HANTS( X[, AMPLITUDE=value] [, DELTA=value] [, DOD=value] [,/DOUBLE] [, ERR_TOLERANCE=value] [, /HIGH] [, /LOW] [, NUM_FREQUENCIES=value] [, NUM_PERIOD=value] [, PHASES=value] [, RANGE_MAXIMUM=value] [, RANGE_MINIMUM=value] [, TIME_SAMPLE=value] [, NUM_IMAGES=value] )
Return Value
The result is an n-element vector of the same data type as the input vector.
Arguments
X
An n-element single- or double-precision floating-point vector containing the reconstructed time-series.
Keywords
AMPLITUDE
Output variable. An array of amplitudes describing the Fourier transform, where the first element is the average of the curve.
DELTA
A scalar number which will be used to suppress high amplitudes.
DOD
The degree of overdeterminedness. The iteration of the code will stop if the number of points reaches the minimum required for curve fitting, plus the DOD.
DOUBLE
Set this keyword to force the computation to be done in double-precision arithmetic.
ERR_TOLERANCE
The error tolerance for the curve fitting. Points deviating more than ERR_TOLERANCE are rejected.
HIGH
Set this keyword to reject outliers which lie above the fitted curve.
LOW
Set this keyword to reject outliers which lie below the fitted curve.
NUM_FREQUENCIES
The number of frequencies to be considered above the zero frequency.
NUM_PERIOD
Length of the base period. Measured in virtual samples.
PHASES
Output variable. An array of phases describing the Fourier transform, where the first element is zero.
RANGE_MAXIMUM
The maximum value to consider, all other values higher are rejected.
RANGE_MINIMUM
The minimum value to consider, all other values lower are rejected.
TIME_SAMPLE
Array of size NUM_IMAGES which give a values of a virtual sample relative to the base period.
NUM_IMAGES
The total number of acual samples in the time series.
Version History
See Also
SMOOTH, TS_DIFF, TS_FCAST