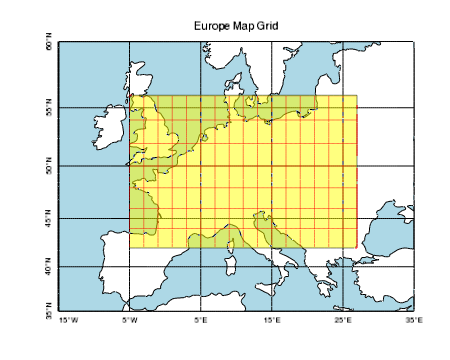
The MAPGRID function plots a map graticule (or grid) onto an existing IDL map graphic.
Example
The following lines create the graphic shown at the top of this topic.
map = MAP('Mercator', LIMIT=[35,-15,60,35], $
LONGITUDE_MIN=-15, LONGITUDE_MAX=35, $
FILL_COLOR = "light blue", $
TITLE='Europe Map Grid')
m1 = MapContinents(FILL_COLOR="white")
map.mapgrid.LABEL_POSITION = 0
map['Latitudes'].LABEL_ANGLE = 90
map['Longitudes'].LABEL_ANGLE = 0
map['15W'].LABEL_ALIGN = 0
grid = MAPGRID(COLOR="red", $
FILL_COLOR="yellow", TRANSPARENCY=50, $
LONGITUDE_MIN=-5, LONGITUDE_MAX=27, $
LATITUDE_MIN=42, LATITUDE_MAX=56, $
GRID_LONGITUDE=2, GRID_LATITUDE=2, $
LABEL_SHOW=0)
foreach gline, grid[['42N','56N']] do gline.thick = 2
foreach gline, grid[['5W','27E']] do gline.thick = 2
Additional Examples
See Map examples for additional examples using the MAPGRID function.
Syntax
graphic = MAPGRID([Properties=value])
Properties
Properties can be set as keywords to the function during creation, or retrieved or changed using the "." notation after creation.
ANTIALIAS, BOX_ANTIALIAS, BOX_AXES, BOX_COLOR, BOX_THICK, CLIP, COLOR, FILL_COLOR, FONT_NAME, FONT_SIZE, FONT_STYLE, GRID_LONGITUDE, GRID_LATITUDE, HIDE, HORIZON_COLOR, HORIZON_LINESTYLE, HORIZON_THICK, LABEL_ALIGN, LABEL_ANGLE, LABEL_COLOR, LABEL_FILL_BACKGROUND, LABEL_FILL_COLOR, LABEL_FORMAT, LABEL_POSITION, LABEL_SHOW, LABEL_VALIGN, LATITUDE_MAX, LATITUDE_ MIN, LONGITUDE_MAX, LONGITUDE_MIN, LATITUDES, LONGITUDES, LINESTYLE, NAME, THICK, TRANSPARENCY, UVALUE, WINDOW, ZVALUE
Methods
Close
ConvertCoord
CopyWindow
Delete
Erase
Order
Print
Refresh
Rotate
Save
Scale
Select
Translate
MapForward
MapInverse
Return Value
The MAPGRID function returns a reference to the created graphic. Use the returned reference to manipulate the graphic after creation by changing properties or by calling methods.
Arguments
None
Keywords
None
Properties
Properties can be set as keywords to the function during creation, or retrieved or changed using the "." notation after creation.
ANTIALIAS
By default anti-aliasing is used when drawing lines. Set this property to 0 to disable anti-aliasing.
BOX_ANTIALIAS
Set this property to turn on antialiasing for box axes. The default value is 0.
BOX_AXES
Set this property to draw box-style axes for Map graphics. In the image on the left, BOX_AXES is not set; on the right, BOX AXES is set.
If the values of the GRID_LATITUDE or GRID_LONGITUDE properties are changed, or if the limits of the map are changed, the box axes are recalculated to fit to the new grid line locations.
Once added, box axes can be hidden by setting the MAPGRID object's BOX_AXES property to 0.
m1 = MAP( /TEST, /BOX_AXES, LIMIT=[35, -95, 65, -45] )
m1.MAPGRID.BOX_AXES = 0
You can change the properties of box axes using the COLOR, BOX_ANTIALIAS, BOX_COLOR, and BOX_THICK properties.
BOX_COLOR
Set this property to a string or RGB vector that specifies the color of the box axes only. When BOX_COLOR is set, the white boxes remain white, but the other boxes change color.
m1 = MAP( /TEST, /BOX_AXES, LIMIT=[35, -95, 65, -45] )
m1.MAPGRID.BOX_COLOR = 'blue'
BOX_THICK
The BOX_THICK property controls the thickness of the box axes. You can specify the integer values 1 through 4 (1 = thinnest, 4 = thickest). The default value is 1.
m1 = MAP( 'Equirectangular', /BOX_AXES, BOX_THICK=2 )
m1.MAPGRID.BOX_THICK=4
CLIP
Set this property to 1 to clip portions of the graphic that lie outside of the dataspace range, or to 0 to disable clipping. The default is 1.
COLOR
Set this property to a string or RGB vector that specifies the color of the grid lines and box axes. If BOX_COLOR has already been set, the COLOR property only affects grid line color. The default value is "black".
m1 = MAP( /TEST, /BOX_AXES, LIMIT=[35, -95, 65, -45] )
m1.MAPGRID.COLOR = 'blue'
FILL_COLOR
Set this property to a string or RGB vector that specifies the color of the filled background. Set this property to a scalar -1 to turn off the fill (this is the default).
FONT_NAME
Set this property equal to a string specifying the IDL or system font for the labels. The default value is "DejaVuSans".
FONT_SIZE
Set this property equal to an integer specifying the font size for the labels. The default value is 9 points.
FONT_STYLE
Set this property equal to an integer or a string specifying the font style for the labels. Allowed values are:
|
Integer |
String |
Resulting Style |
|
0 |
"Normal" or "rm"
|
Default (roman) |
|
1 |
"Bold" or "bf" |
Bold |
|
2 |
"Italic" or "it"
|
Italic |
|
3 |
"Bold italic" or "bi"
|
Bold italic |
GRID_LONGITUDE
The longitude grid spacing, in degrees.
GRID_LATITUDE
The latitude grid spacing, in degrees.
HIDE
Set this property to 1 to hide the graphic. Set HIDE to 0 to show the graphic.
HORIZON_COLOR
Set this property to a string or RGB vector that specifies the color of the horizon line. The default value is "black".
Note: Setting the HORIZON_COLOR will automatically turn on the horizon line.
HORIZON_LINESTYLE
Set this property to an integer or string specifying the line style for the horizon line. MAPGRID will draw the horizon line around the border of the map.
The default is 'none' (no horizon line). If the HORIZON_LINESTYLE is currently set to 'none' (no line), then setting either the HORIZON_COLOR or HORIZON_THICK will automatically change the HORIZON_LINESTYLE to 'solid_line'.
The following table lists the index values and strings you can use with this property.
|
Index |
Property |
Description |
|
0 |
'solid_line', '-'(dash)
|
solid line |
|
1 |
'dot', ':'(colon)
|
dotted |
|
2 |
'dash', '--' (double dashes)
|
dashed |
|
3 |
'dash_dot', '-.'
|
dash dot |
|
4 |
'dash_dot_dot_dot', '-:'
|
dash dot dot dot
|
|
5 |
'long_dash', '__' (two underscores)
|
long dash |
|
6 |
'none', ' ' (space)
|
no line |
You can also set the line style to a two-element vector, [repeat, bitmask], specifying a stippling pattern. The repeat indicates the number of times that individual bits in the bitmask should be repeated. (That is, if three consecutive 0’s appear in the bitmask and the value of repeat is 2, then the line that is drawn will have six consecutive bits turned off.) The value of repeat must be an integer between 1 and 255. The bitmask indicates which pixels are drawn and which are not along the length of the line. The bitmask should be specified as a 16-bit hexadecimal value. For example, [2, 'AAAA'X] describes a dashed line with very short dashes of length 2 bits each.
HORIZON_THICK
Set this property to a value between 0 and 10 that specifies the thickness of the horizon line. A thickness of 0 displays a thin hairline on the chosen device. The default value is 1.
Note: Setting the HORIZON_THICK will automatically turn on the horizon line.
LABEL_ALIGN
Set this property to the left-right alignment of the text labels, where 0.0 is left justified, 1.0 is right justified, and 0.5 is centered. The default value depends upon the LABEL_POSITION and LABEL_ANGLE.
Note: Setting either LABEL_POSITION or LABEL_ANGLE will reset the LABEL_ALIGN to its default value.
LABEL_ANGLE
Set this property to the rotation angle of the text labels, in degrees from 0 to 360. Set this property to -1 to automatically compute the angle for each grid line (this is the default behavior).
LABEL_COLOR
Set this property to a string or RGB vector that specifies the color of the label text. The default is the same as the COLOR.
LABEL_FILL_BACKGROUND
Set this property to 1 to fill the label background. The default is 0, unfilled.
LABEL_FILL_COLOR
Set this property to a string or RGB vector that specifies the color to use if the label background is filled. The default is -1, which makes the label background have the same color as the window background.
LABEL_FORMAT
Set this property to a string giving the name of an IDL function to be used as a callback when constructing the grid labels. If this property is a null string, then the default labels are used. The default label has two different styles:
- If all of the grid locations are integers, then the label format is given by ddd°N|S|E|W, where ddd is the absolute value of the latitude or longitude in degrees, and the N|S|E|W gives the cardinal direction.
- If one or more of the locations are floating-point numbers (non-integers), then the label format is given by ddd°mm'ss"N|S|E|W, where ddd is the absolute value of the integer latitude or longitude in degrees, mm is the arc minutes, ss is the arc seconds, and the N|S|E|W gives the cardinal direction
For more control over the grid labels, set the LABEL_FORMAT property to an IDL function name. The callback function is called with four parameters: Orientation, Location, Fractional, and DefaultLabel, where:
- Orientation is 0 for a line of longitude (e.g. 120°E) and 1 for a line of latitude (e.g. 45°S)
- Location is the location value (e.g. 120 for 120°E, or -45 for 45°S)
- Fractional is 0 if all of the grid lines are integers, and 1 if any of the grid lines are floating-point numbers (non-integers)
- DefaultLabel is a string giving the default label as computed by MAPGRID
The function will be called multiple times, each time passing in a different orientation and location, until all of the longitude and latitude labels have been computed. The function should return a scalar string representing the label for that particular grid line. As an example, save the following code into a file mapgrid_labels.pro:
function MapGrid_Labels, orientation, location, fractional, defaultlabel
if (location eq 0) then $
return, orientation ? 'Equator' : 'Prime Meridian'
degree = '!M' + STRING(176b)
label = STRTRIM(ROUND(ABS(location)),2) + degree
suffix = orientation ? ((location lt 0) ? 'S' : 'N') : $
((location lt 0) ? 'W' : 'E')
return, label + suffix
end
Now execute the following command:
m = MAP(/TEST, LABEL_FORMAT='MapGrid_Labels')
Note: If any of the GRID_LONGITUDE, GRID_LATITUDE, LONGITUDE_MIN/MAX, or LATITUDE_MIN/MAX properties are changed, then the function will be called again to compute the new labels.
LABEL_POSITION
Set this property to a number between 0 and 1 giving the normalized label position along the grid line. The default is 0.5, which centers the labels.
LABEL_SHOW
Set this property to 1 to insert labels (the default behavior), or to 0 to hide the labels.
LABEL_VALIGN
Set this property to the vertical alignment of the text labels, where 0.0 is bottom justified, 1.0 is top justified, and 0.5 is centered. The default value depends upon the LABEL_POSITION and LABEL_ANGLE.
Note: Setting either LABEL_POSITION or LABEL_ANGLE will reset the LABEL_VALIGN to its default value.
LATITUDE_MAX
The maximum grid latitude, in degrees.
LATITUDE_MIN
Minimum latitude, in degrees, to include in the grid.
LONGITUDE_MAX
Maximum longitude, in degrees, to include in the grid.
LONGITUDE_MIN
Minimum longitude, in degrees, to include in the grid.
LATITUDES
This property retrieves an array of MAPGRIDLINE objects, representing the latitude lines. See the LONGITUDES property below for a list of the available properties.
LINESTYLE
Set this property to an integer or string specifying the grid line style.
The following table lists the index values and strings you can use with this property.
|
Index |
Property |
Description |
|
0 |
'solid_line', '-'(dash)
|
solid line |
|
1 |
'dot', ':'(colon)
|
dotted |
|
2 |
'dash', '--' (double dashes)
|
dashed |
|
3 |
'dash_dot', '-.'
|
dash dot |
|
4 |
'dash_dot_dot_dot', '-:'
|
dash dot dot dot
|
|
5 |
'long_dash', '__' (two underscores)
|
long dash |
|
6 |
'none', ' ' (space)
|
no line |
You can also set the line style to a two-element vector, [repeat, bitmask], specifying a stippling pattern. The repeat indicates the number of times that individual bits in the bitmask should be repeated. (That is, if three consecutive 0’s appear in the bitmask and the value of repeat is 2, then the line that is drawn will have six consecutive bits turned off.) The value of repeat must be an integer between 1 and 255. The bitmask indicates which pixels are drawn and which are not along the length of the line. The bitmask should be specified as a 16-bit hexadecimal value. For example, [2, 'AAAA'X] describes a dashed line with very short dashes of length 2 bits each.
LONGITUDES
This property retrieves an array of MAPGRIDLINE objects, representing the longitude lines. You can get and set the following properties on the retrieved MAPGRIDLINE objects:
|
Property |
Description |
|
ANTIALIAS |
Set to 1 to enable anti-aliasing for the line.
|
|
COLOR |
A string or RGB vector containing the line color.
|
|
FONT_NAME |
The font name for the label.
|
|
FONT_SIZE |
The font size (in points) for the label.
|
|
FONT_STYLE |
An integer or string giving the font style for the label.
|
|
HIDE |
Set to 1 to hide the crosshair, 0 to show.
|
|
LABEL_ALIGN |
A number giving the left-right alignment of the label.
|
|
LABEL_ANGLE |
The rotation angle of the text labels, in degrees.
|
|
LABEL_COLOR |
A string or RGB vector giving the label color.
|
|
LABEL_FILL_BACKGROUND
|
Set to 1 to fill the label background.
|
|
LABEL_FILL_COLOR
|
A string or RGB vector giving the label background color.
|
|
LABEL_FORMAT |
A string giving the name of a callback function.
|
|
LABEL_POSITION |
A number from 0-1 giving the label position along the line.
|
|
LABEL_SHOW |
Set to 1 to show the label, 0 to hide.
|
|
LABEL_VALIGN |
A number giving the vertical alignment of the label.
|
|
LINESTYLE |
An integer or string giving the line style.
|
|
LOCATION |
The location (in degrees) of the grid line.
|
|
NAME |
The name of the graphic.
|
|
THICK |
The thickness of the line.
|
|
TRANSPARENCY |
The percent transparency of the line. The default is 50.
|
|
UVALUE |
An IDL variable of any data type.
|
|
ZVALUE |
The Z coordinate for the line.
|
For example, use the LONGITUDES property to hide the labels on every other grid line:
m = MAP('Equirectangular', GRID_LONGITUDE=10)
mg = m.MAPGRID
mlons = mg.LONGITUDES
for i=0,N_ELEMENTS(mlons)-1,2 do mlons[i].LABEL_SHOW=0
Note: Changing one of these properties will only affect that particular MAPGRIDLINE object. However, if that same property is later changed on the parent MAPGRID object, it will overide the individual property values on the MAPGRIDLINE children.
Note: If you set any of the GRID_LONGITUDE, GRID_LATITUDE, LATITUDE_MIN/MAX, or LONGITUDE_MIN/MAX properties, then the MAPGRIDLINE objects may be automatically destroyed. In this case, you should retrieve the LONGITUDES or LATITUDES again to ensure that you have valid objects.
NAME
A string that specifies the name of the graphic. The name can be used to retrieve the graphic using the brackets array notation. If NAME is not set then a default name is chosen based on the graphic type.
THICK
Set this property to a value between 0 and 10 that specifies the thickness of the grid lines. A thickness of 0 displays a thin hairline on the chosen device. The default value is 1.
TRANSPARENCY
An integer between 0 and 100 that specifies the percent transparency of the grid. The default value is 0.
UVALUE
Set this property to an IDL variable of any data type.
WINDOW (Get Only)
This property retrieves a reference to the WINDOW object which contains the graphic.
ZVALUE
Set this property to a scalar value to be used as the z-coordinate for the grid lines. By default, 0.0 is used as the z-coordinate.
Version History
|
8.0 |
Introduced |
|
8.1 |
Added the following properties: BOX_ANTIALIAS, BOX_AXES, BOX_COLOR, and BOX_THICK, UVALUE, ZVALUE
The THICK property was changed to accept a value between 0 and 10
Added the following methods: Delete, MapForward, MapInverse
|
|
8.2 |
Added CLIP, LABEL_FORMAT, LATITUDES, LONGITUDES properties
|
|
8.2.1 |
Added ANTIALIAS property
|
|
8.2.2 |
Added HORIZON_COLOR, HORIZON_LINESTYLE, and HORIZON_THICK properties.
|
|
8.2.3 |
Added the ability to use a stippling pattern for HORIZON_LINESTYLE and LINESTYLE.
|
| 8.6 |
Changed default font name. |
See Also
!COLOR, PLOT, POLYGON, Using IDL graphics