The XPLOT3D procedure is a utility for creating and interactively manipulating 3-D plots.
This routine is written in the IDL language. Its source code can be found in the file xplot3d.pro in the lib/utilities subdirectory of the IDL distribution.
Using XPLOT3D
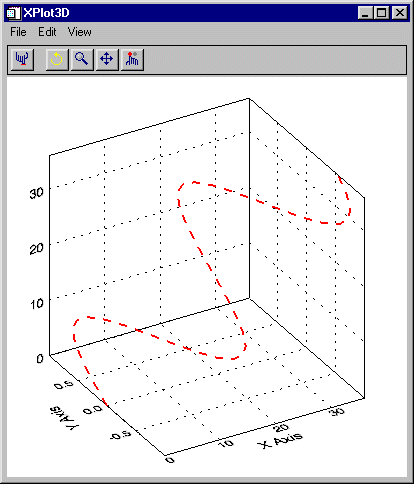
XPLOT3D displays a resizeable top-level base with a menu, toolbar and draw widget, as shown in the following figure:

The XPLOT3D Toolbar
The XPLOT3D toolbar contains the following buttons:
|
Button |
Tool Name |
Function |
|

|
Reset
|
Resets rotation, scaling, and panning.
|
|

|
Rotate
|
Click the left mouse button on the object and drag to rotate.
|
|

|
Pan
|
Click the left mouse button on the object and drag to pan.
|
|

|
Zoom
|
Click the left mouse button on the object and drag to zoom in or out.
|
|

|
Select
|
Click on the object. The name of the selected object is displayed, if the object has a name, otherwise its class is displayed.
|
Projecting Data onto Plot “Walls”
To turn on or off the projection of data onto the walls of the box enclosing the 3-D plot, select All On, All Off, XY, YZ, or XZ from the View > 2D Projection menu.
Changing the Axis Type
The View > Axes menu allows you to select one of the following types of axes:
- Simple Axes: Displays the X, Y, and Z axes as lines.
- Box Axes: Displays the X, Y, and Z axes as planes.
- No Axes: Turns off the display of axes.
Syntax
XPLOT3D, X, Y, Z [, /BLOCK] [, COLOR=[r,g,b]] [, /DOUBLE_VIEW] [, GROUP=widget_id] [, LINESTYLE={0 | 1 | 2 | 3 | 4 | 5 | 6}] [, /MODAL] [, NAME=string] [, /OVERPLOT] [, SYMBOL=objref(s)] [, /TEST] [, THICK=points{1.0 to 10.0}] [, TITLE=string] [, XRANGE=[min, max]] [, XTITLE=string] [, YRANGE=[min, max]] [, YTITLE=string] [, ZRANGE=[min, max]] [, ZTITLE=string]
Arguments
X
A vector of X data values.
Y
A vector of Y data values.
Z
A vector of Z data values.
Keywords
BLOCK
Set this keyword to have XMANAGER block when this application is registered. By default, BLOCK is set equal to zero, providing access to the command line if active command line processing is available. Note that setting the BLOCK keyword causes all widget applications to block, not just this application. For more information, see the documentation for the NO_BLOCK keyword to XMANAGER.
Note: Only the outermost call to XMANAGER can block. Therefore, to have XPLOT3D block, any earlier calls to XMANAGER must have been called with the NO_BLOCK keyword. See the documentation for the NO_BLOCK keyword to XMANAGER for an example.
COLOR
Set this keyword to an [r, g, b] triplet specifying the color of the curve.
DOUBLE_VIEW
Set this keyword to cause XPLOT3D to set the DOUBLE property on the IDLgrView that it uses to display the plot.
GROUP
Set this keyword to the widget ID of the widget that calls XPLOT3D. When this keyword is specified, the death of the caller results in the death of XPLOT3D.
LINESTYLE
Set this keyword to a value indicating the line style that should be used to draw the curve. The value can be either an integer value specifying a pre-defined line style, or a 2-element vector specifying a stippling pattern.
To use a pre-defined line style, set the LINESTYLE keyword to one of the following integer values:
|
0 |
Solid line (default)
|
|
1 |
Dotted |
|
2 |
Dashed |
|
3 |
Dash-dot |
|
4 |
Dash-dot-dot-dot
|
|
5 |
Long dash |
|
6 |
No line drawn |
To define your own stippling pattern, specify a two-element vector [repeat, bitmask], where repeat indicates the number of times consecutive runs of 1s or 0s in the bitmask should be repeated. (That is, if three consecutive 0s appear in the bitmask and the value of repeat is 2, then the line that is drawn will have six consecutive bits turned off.) The value of repeat must be in the range 1 ≤ repeat ≥ 255.
The bitmask indicates which pixels are drawn and which are not along the length of the line. The bitmask is most conveniently specified as a 16-bit hexadecimal value.
For example, LINESTYLE = [2, 'F0F0'X] describes a dashed line (8 bits on, 8 bits off, 8 bits on, 8 bits off).
MODAL
Set this keyword to block processing of events from other widgets until the user quits XPLOT3D. The MODAL keyword does not require a group leader to be specified. If no group leader is specified, and the MODAL keyword is set, XPLOT3D fabricates an invisible group leader for you.
Note: To be modal, XPLOT3D does not require that its caller specify a group leader. This is unlike other IDL widget procedures such as XLOADCT, which, to be modal, do require that their caller specify a group leader. These other procedures were implemented this way to encourage the caller to create a modal widget that will be well-behaved with respect to layering and iconizing. (See "Iconizing, Layering, and Destroying Groups of Top-Level Bases for more information.)
To provide a simple means of invoking XPLOT3D as a modal widget in applications that contain no other widgets, XPLOT3D can be invoked as MODAL without specifying a group leader, in which case XPLOT3D fabricates an invisible group leader for you. For applications that contain multiple widgets, however, it is good programming practice to supply an appropriate group leader when invoking XPLOT3D, /MODAL. As with other IDL widget procedures with names prefixed with “X”, specify the group leader via the GROUP keyword.
NAME
Set this keyword to a string specifying the name for the data curve being plotted. The name is displayed on the XPLOT3D toolbar when the curve is selected with the mouse. (To select the curve with the mouse, XPLOT3D must be in select mode. You can put XPLOT3D in select mode by clicking on the rightmost button on the XPLOT3D toolbar.)
OVERPLOT
Set this keyword to draw the curve in the most recently created view. The TITLE, [XYZ]TITLE, [XYZ]RANGE, and MODAL keywords are ignored if this keyword is set.
SYMBOL
Set this keyword to a vector containing one or more instances of the IDLgrSymbol object class to indicate the plotting symbols to be used at each vertex of the polyline. If there are more vertices than elements in SYMBOL, the elements of the SYMBOL vector are cyclically repeated. By default, no symbols are drawn. To remove symbols from a polyline, set SYMBOL to a scalar.
TEST
If set, the X, Y, and Z arguments are not required (and are ignored if provided). A sinusoidal curve is displayed instead. This allows you to test code that uses XPLOT3D without having to specify plot data.
THICK
Set this keyword to a value between 1.0 and 10.0, specifying the line thickness to be used to draw the polyline, in points. The default is 1.0 points.
TITLE
Set this keyword to a string to appear in the XPLOT3D title bar.
XRANGE
Set this keyword to a 2-element array of the form [min, max] specifying the X-axis range.
XTITLE
Set this keyword to a string specifying the title for the X axis of the plot.
YRANGE
Set this keyword to a 2-element array of the form [min, max] specifying the Y-axis range.
YTITLE
Set this keyword to a string specifying the title for the Y axis of the plot.
ZRANGE
Set this keyword to a 2-element array of the form [min, max] specifying the Z-axis range.
ZTITLE
Set this keyword to a string specifying the title for the Z axis of the plot.
Examples
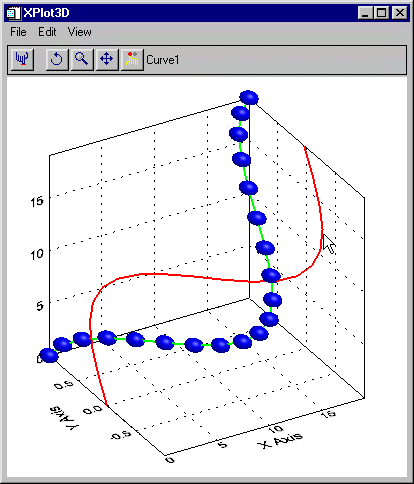
The following example displays two curves in XPLOT3D, using a custom plotting symbol for one of the curves:
X = INDGEN(20)
Y1 = SIN(X/3.)
Y2 = COS(X/3.)
Z = X
XPLOT3D, X, Y1, Z, NAME='Curve1', THICK=2
oOrb = OBJ_NEW('orb', COLOR=[0, 0, 255])
oOrb->Scale, .75, .1, .5
oSymbol = OBJ_NEW('IDLgrSymbol', oOrb)
XPLOT3D, X, Y2, Z, COLOR=[0,255,0], NAME='Curve2', $
SYMBOL=oSymbol, THICK=2, /OVERPLOT
This code results in the following:

Version History
See Also