Note: Please see the MAP function, which replaces the functionality of this routine.
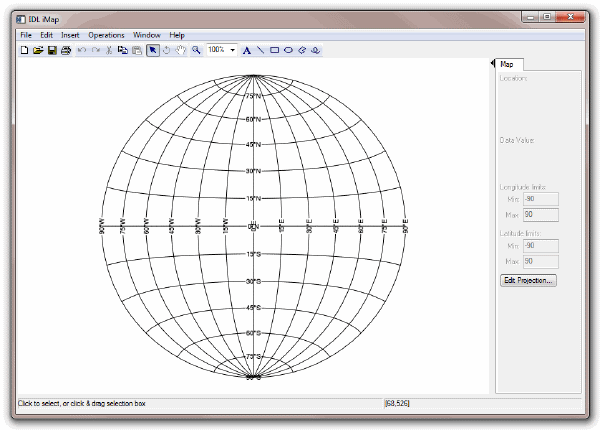
Note: If no arguments are specified, the IMAP procedure creates an empty iMap tool.
Syntax
Empty Map Projection
IMAP [, MAP_PROJECTION=string]
Image Visualization
IMAP [, Image[, X, Y]] [, GEOTIFF=variable] [, GRID_UNITS=value] [, MAP_PROJECTION=string]
or
IMAP [, Filename]
Shapefile Visualization
IMAP [, Shapefile]
Contour Visualization
IMAP [, Z[, X, Y]] , /CONTOUR [, GRID_UNITS=value] [, MAP_PROJECTION=string]
iTools Common Keywords
iTool Image Keywords: This procedure accepts all IIMAGE keywords. For more information, see IIMAGE.
iTool Contour Keywords: If the CONTOUR keyword is set, this procedure accepts all ICONTOUR keywords. For more information, see ICONTOUR.
Map Projection Keywords: [, CENTER_LATITUDE=value] [, CENTER_LONGITUDE=value] [, ELLIPSOID=string] [, FALSE_EASTING=value] [, FALSE_NORTHING=value] [, HEIGHT=value] [, HEMISPHERE={0 | 1}] [, HOM_AZIM_LONGITUDE=value] [, HOM_AZIM_ANGLE=value] [, HOM_LATITUDE1=value] [, HOM_LATITUDE2=value] [, HOM_LONGITUDE1=value] [, HOM_LONGITUDE2=value] [, IS_ZONES=value] [, IS_JUSTIFY=value] [, LIMIT=[latmin, lonmin, latmax, lonmax]] [, MERCATOR_SCALE=value] [, OEA_ANGLE=value] [, OEA_SHAPEM=value] [, OEA_SHAPEN=value] [, SEMIMAJOR_AXIS=value] [, SEMIMINOR_AXIS=value] [, SOM_INCLINATION=value] [, SOM_LONGITUDE=value] [, SOM_PERIOD=value] [, SOM_RATIO=value] [, SOM_FLAG=value] [, SOM_LANDSAT_NUMBER=value] [, SOM_LANDSAT_PATH=value] [, SPHERE_RADIUS=value] [, STANDARD_PARALLEL=value] [, STANDARD_PAR1=value] [, STANDARD_PAR2=value] [, TRUE_SCALE_LATITUDE=value] [, ZONE=value]
Image Visualization Arguments
Image
A vector, a two-dimensional array, or a three-dimensional array representing the sample values to be displayed as an image.
If Image is a vector:
- The X and Y arguments must also be present and contain the same number of elements. In this case, a dialog will be presented that offers the option of gridding the data to a regular grid (the results of which will be displayed as an indexed-color image).
If Image is a two-dimensional array:
- If either dimension is 3:
Image represents an array of x, y, and z values (either [[x0, y0, z0], [x1, y1, z1], ..., [xn, yn, zn]] or [[x0, x1, ..., xn], [y0, y1, ..., yn], [z0, z1, ..., zn]] where n is the length of the other dimension). In this case, the X and Y arguments, if present, will be ignored. A dialog will be presented that allows the option of gridding the data to a regular grid (the results of which will be displayed as an indexed-color image, using the z values as the image data values).
- If neither dimension is 3:
Image represents an array of sample values to be displayed as a color-indexed image. If X and Y are provided, the sample values are defined as a function of the corresponding (x, y) locations; otherwise, the sample values are implicitly treated as a function of the array indices of each element of Image.
If Image is a three-dimensional array:
- If one of the dimensions is 3:
Image is a 3 x n x m, n x 3 x m, or n x m x 3 array representing the red, green, and blue channels of the image to be displayed.
- If one of the dimensions is 4:
Image is a 4 x n x m, n x 4 x m, or n x m x 4 array representing the red, green, blue, and alpha channels of the image to be displayed.
X
Either a vector or a two-dimensional array representing the x-coordinates of the image grid.
If the Image argument is a vector:
- X must be a vector with the same number of elements as Image.
If the Image argument is a two-dimensional array (for which neither dimension is 3):
Each element of X specifies the x-coordinates for a column of Image (e.g., X[0] specifies the x-coordinate for Image[0, *]).
- If X is a two-dimensional array:
Each element of X specifies the x-coordinate of the corresponding point in Image (Xij specifies the x-coordinate of Imageij).
Y
Either a vector or a two-dimensional array representing the y-coordinates of the image grid.
If the Image argument is a vector:
- Y must be a vector with the same number of elements.
If the Image argument is a two-dimensional array:
Each element of Y specifies the y-coordinates for a column of Image (e.g., Y[0] specifies the y-coordinate for Image[*, 0]).
- If Y is a two-dimensional array:
Each element of Y specifies the y-coordinate of the corresponding point in Image (Yij specifies the y-coordinate of Imageij).
Filename
The name of a file that contains image data. Calling IMAP wtih the Filename argument is equivalent to calling IOPEN and passing the resulting data into IMAP as the first argument.
Note: You can not use the Filename argument with the /CONTOUR keyword.
Shapefile Visualization Arguments
Shapefile
An object reference to an IDLffShape object, or the file name of a Shapefile.
Note: An IDLffShape object is created when you use the IOPEN routine or the File > New menu item in the IDL Workbench.
Contour Visualization Arguments
Z
A vector or two-dimensional array containing the values to be contoured. If the X and Y arguments are provided, the contour is plotted as a function of the (x, y) locations specified by their contents. Otherwise, the contour is generated as a function of the two-dimensional array index of each element of Z.
X
A vector or two-dimensional array specifying the x-coordinates for the contour surface. If X is a vector, each element of X specifies the x-coordinate for a column of Z (e.g., X[0] specifies the x-coordinate for Z[0, *]). If X is a two-dimensional array, each element of X specifies the x-coordinate of the corresponding point in Z (i.e., Xij specifies the x-coordinate for Zij).
Y
A vector or two-dimensional array specifying the y-coordinates for the contour surface. If Y is a vector, each element of Y specifies the y-coordinate for a row of Z (e.g., Y[0] specifies the y-coordinate for Z[*,0]). If Y is a two-dimensional array, each element of Y specifies the y-coordinate of the corresponding point in Z (Yij specifies the y-coordinate for Zij).
Keywords
Note: Keywords to the IMAP routine that correspond to the names of registered properties of the iMap tool must be specified in full, without abbreviation.
Image Keywords
GEOTIFF
Set this keyword equal to an anonymous structure containing the GeoTIFF tags (for information on GeoTIFF tags, see the GEOTIFF keyword in the READ_TIFF function) from a GeoTIFF file. This keyword is valid only when creating an image visualization, and is ignored if the CONTOUR keyword is set.
GRID_UNITS
Set this keyword to an integer specifying the units for the image or contour grid. This keyword applies only when there is a map projection inserted. It has the following values:
- 0: None. The image or contour grid is in arbitrary units that are not tied to a map projection. The image or contour will not be warped to the current map projection.
- 1: Meters. The image or contour grid is in meters, and is tied to a particular map projection. The image or contour will be automatically warped to the current map projection. You are responsible for choosing the dataspace map projection that matches the image or contour’s map projection.
- 2: Degrees. The image or contour grid is in degrees longitude/latitude, and will be automatically warped to the current map projection.
MAP_PROJECTION
See the MAP_PROJECTION keywords.
iTools Common Keywords
ASPECT_RATIO
A floating point value indicating the ratio of the Y dimension to the X dimension in data units. If this property is set to a nonzero value, the aspect ratio will be preserved as the visualization is stretched or shrunk. The default value is 0 for all visualizations except images, meaning that the aspect ratio is not fixed, but is allowed to change as the visualization is stretched or shrunk.
ASPECT_Z
For 3-D graphics, a floating point value indicating the ratio of the Z dimension to the X and Y dimensions, in data units. If this is a nonzero value, the aspect ratio will be preserved as the visualization is stretched or shrunk. The default value is 0, meaning that the aspect ratio is not fixed, but is allowed to change as the visualization is stretched or shrunk.
AXIS_STYLE
Set this keyword to one of the following values to specify the axis style.
|
0
|
No axes
|
| 1
|
Default Axes: at dataspace minimum values
|
| 2
|
Box axes: at dataspace minimum and maximum values
|
| 3
|
Crosshair axes: at dataspace median values
|
BACKGROUND_COLOR
Set this keyword to an RGB value specifying the color to be used as the background color for the view. The default is [255, 255, 255] (white). The BACKGROUND_COLOR keyword can be used when a tool is being created or when a new visualization is being created in an existing tool with the use of the OVERPLOT, VIEW_NUMBER or VIEW_NEXT keywords. The background color is applied to the current view. For example, if multiple views have been created with the VIEW_GRID keyword, and the VIEW_NUMBER keyword is used to create a visualization in the second view, use of the BACKGROUND_COLOR keyword would set the background color in the second view only.
CURRENT
Set this keyword to direct the graphical output of the visualization to a new data space in the current tool. If no tool exists, a new tool is created.
CURRENT_ZOOM
Set this keyword to the zoom factor to be used for the current view. The default value is 1.0, which represents 100%.
DEPTHCUE_BRIGHT
Set this keyword to a floating-point value giving the distance in the Z plane at which the objects in the view begin to fade into the background color. The values range from -1 (closest to the viewer) to +1 (farthest from the viewer). The default value is 0. See DEPTHCUE_DIM for examples.
DEPTHCUE_DIM
Set this keyword to a floating-point value giving the distance in the Z plane at which the objects in the view have completely faded into the background color. The values range from -1 (closest to the viewer) to +1 (farthest from the viewer). The default value is 0. Some usage examples are:
Depth cue is disabled and no fading will occur.
Objects farther than Zbright will begin to fade into the background, and objects farther than Zdim will be completed faded. This is useful for simulating fog.
Objects closer than Zbright will begin to fade into the background, and objects closer than Zdim will be completely faded. This is useful for simulating lighting at a distance.
DEVICE
Set this keyword if values are specified in device coordinates (pixels) for the POSITION keyword. (Normalized coordinates are the default for these keywords.)
DIMENSIONS
Set this keyword to a two-element vector of the form [width, height] to specify the dimensions of the drawing area of the specific tool in device units. The minimum width of the window correlates to the width of the menubar. The minimum window height is 100 pixels.
DISABLE_SPLASH_SCREEN
Set this keyword to disable the iTools splash screen. By default, the first time an iTool is run, the splash screen is displayed.
FIT_TO_VIEW
Set this keyword to automatically scale the newly-created visualization so that it fills the current view. This keyword is ignored if VIEW_ZOOM is present.
FONT_COLOR
Set this keyword equal to an RGB vector specifying the title text color. The default is [0, 0, 0] (black).
This keyword applies only to the text annotation created by the TITLE keyword. It is ignored if TITLE is not specified.
FONT_NAME
Set this keyword equal to a string specifying the name of the IDL or system font to use for the title text. The default is “Helvetica”.
This keyword applies only to the text annotation created by the TITLE keyword. It is ignored if TITLE is not specified.
FONT_SIZE
Set this keyword equal to an integer specifying the font size for the title text. The default is 16 pt.
This keyword applies only to the text annotation created by the TITLE keyword. It is ignored if TITLE is not specified.
FONT_STYLE
Set this keyword equal to an integer specifying the font style to be used for the title text. Allowed values are:
|
0
|
Normal (the default)
|
|
1
|
Bold |
|
2
|
Italic |
|
3
|
Bold Italic |
This keyword applies only to the text annotation created by the TITLE keyword. It is ignored if TITLE is not specified.
IDENTIFIER
Set this keyword to a named IDL variable that will contain the iToolID for the created tool. This value can then be used to reference this tool during overplotting operations or command-line-based tool management operations.
LAYOUT
Set this keyword to a three-element vector [ncol, nrow, index] to arrange graphics in a grid. The first dimension ncol is the number of columns in the grid, nrow is the number of rows, and index is the grid position at which to place the graphic (starting at element 1). This keyword is ignored if either OVERPLOT or POSITION is specified.
LOCATION
Set this keyword to a two-element vector of the form [x, y] to specify the location of the upper left-hand corner of the tool relative to the display screen, in device units.
Note: Some X Window managers explicitly ignore any request from the client for window placement.
MACRO_NAMES
Set this keyword to a scalar string or an array of strings that specifies the names of one or more macros to run. The macro names are retrieved and the macros are run sequentially after the iTool and (if applicable) any visualizations have been created. If a macro of the specified name does not exist, IDL generates an error and the routine exits.
MARGIN
Set this keyword to specify the current graphic’s margin values in the layout specified by the LAYOUT keyword. Set MARGIN to a scalar value to use the same margin on all sides, or set MARGIN to a four-element vector [left, bottom, right, top] to specify different margins on each side.
Margin values are expressed in normalized units ranging from 0.0 to 0.5.
This keyword is ignored if either OVERPLOT or POSITION is specified. If the DEVICE keyword is used, the values are given in device units (pixels).
NAME
Set this keyword to a string to specify the name for this visualization.
NO_SAVEPROMPT
Set this keyword to cause the iTool not to prompt the user to save changes when closing the tool. The default is to prompt the user to save changes.
NORMAL
Set this optional keyword if input arguments are specified in normalized [0, 1] coordinates for the POSITION keyword. (Normalized coordinates are the default for these keywords.)
OVERPLOT
Set this keyword to an iToolID to direct the graphical output of the visualization to the tool specified by the provided iToolID.
Set this keyword to 1 (one) to place the graphical output of the visualization in the current tool. If no current tool exists, a new tool is created.
This iToolID can be obtained during the creation of a previous tool or from the iGetCurrent routine.
POSITION
POSITION is a four-element vector that determines the location of the visualization within the iTool window. The coordinates x0, y>0, represent the lower left and x1, y1, represent the upper right corners of the data space. Coordinates are expressed in normalized units ranging from 0.0 to 1.0. If the DEVICE keyword is present, the units are given in device units (pixels).
Note: When using POSITION, factor in enough space to display the title and axis labels. For example, if you use POSITION to place your visualization at 0 on the X or Y axis, any labels for that axis will not be visible.
RENDERER
Set this keyword to override the value specified by the IDL_GR_WIN_RENDERER (Windows) or IDL_GR_X_RENDERER (UNIX) preference for the iTool. IDL will use the specified graphics renderer when drawing objects within the iTool window. Valid values are:
|
0 |
Use platform native OpenGL
|
|
1 |
Use IDL’s software implementation
|
If your platform does not have a native OpenGL implementation, IDL uses its own software implementation regardless of the value of this property.
STRETCH_TO_FIT
Set this keyword to indicate whether the visualizations should be stretched to fit within the view. The default value is 1 (True).
STYLE_NAME
Set this keyword equal to a string that specifies the name of a user-defined or a system style. If a style of the specified name does not exist, IDL generates an error and the routine exits.
The style is applied using the following rules:
- If the tool exists and /OVERPLOT is specified, then the style is only applied to the newly-created visualizations within the current view. The current tool style is not updated with the new style, nor is the style applied to any other items within the view.
- Otherwise, if the tool exists and either VIEW_NEXT or VIEW_NUMBER is being used to select a different view, then the style is applied to all items within that view. The current tool style is updated with the new style.
- Otherwise, if a new tool is being created, then the style is applied to all items within all views. The current tool style is updated with the new style.
TITLE
Set this keyword to a string specifying a title for the newly-created visualization. The text annotation will be added to the dataspace containing the new visualization. If the TITLE is specified, you can also specify any of the FONT_COLOR, FONT_NAME, FONT_SIZE, and FONT_STYLE keywords to control the title appearance.
Note: Prior to IDL version 7.1, the TITLE keyword specified the title for the iTool window rather than for the visualization. Use the WINDOW_TITLE keyword to create a window title.
VIEW_GRID
Set this keyword to a two-element vector of the form [columns, rows] to specify the view layout within the new tool. This keyword is only used if a new tool is being created (for example, if OVERPLOT, VIEW_NEXT, or VIEW_NUMBER are specified then VIEW_GRID is ignored).
VIEW_NEXT
Set this keyword to change the view selection to the next view following the currently-selected view before issuing any graphical commands. If the currently-selected view is the last one in the layout, then /VIEW_NEXT will cause the first view in the layout to become selected. This keyword is ignored if no current tool exists.
Note: The contents of the newly-selected view will be emptied unless /OVERPLOT is set.
VIEW_NUMBER
Set this keyword to change the currently-selected view to the view specified by the VIEW_NUMBER before issuing any graphical commands. The view number starts at 1, and corresponds to the position of the view within the graphics container (not necessarily the position on the screen). This keyword is ignored if no current tool exists.
Note: The contents of the newly-selected view will be emptied unless /OVERPLOT is set.
VIEW_TITLE
Set this keyword equal to a scalar string that will be placed in a text annotation centered horizontally in the current view, near the top. The text will be created with the properties (size, style, color, etc.) defined for text annotations in the current tool style.
VIEW_ZOOM
Set this keyword to a floating-point number giving the initial view zoom factor. For example, setting VIEW_ZOOM to 2.0 would give an initial zoom of 200%. The default is 1.0.
WINDOW_TITLE
Set this keyword to a string to specify a title for the tool window. The title is displayed in the title bar of the tool.
[XYZ]GRIDSTYLE
The index of the linestyle to be used for plot tickmarks and grids (i.e., when [XYZ]TICKLEN is set to 1.0). See LINESTYLE for a list of linestyles.
[XYZ]MAJOR
Set this keyword to an integer representing the number of major tick marks. The default is -1, specifying that IDL will compute the number of tickmarks. Setting MAJOR equal to zero suppresses major tickmarks entirely. ZMAJOR is for three-dimensional plots only.
[XYZ]MINOR
Set this keyword to an integer representing the number of minor tick marks. The default is -1, specifying that IDL will compute the number of tickmarks. Setting MINOR equal to zero suppresses minor tickmarks entirely. ZMINOR is for three-dimensional plots only.
[XYZ]RANGE
Set this keyword to the desired data range of the axis, a 2-element vector. The first element is the axis minimum, and the second is the maximum. ZRANGE is for three-dimensional plots only.
[XYZ]STYLE
The axis range style. The valid values are:
(0) Set the axes to have a "nice" range (based on the tick marks). This is the default value for all visualizations except for Images and Maps.
(1) Force the axes ranges to exactly match the data. This is the default value for Images and Maps.
(2) Pad the axes to extend slightly beyond the "nice" range.
(3) Pad the axes to extend slightly beyond the exact data range.
The [XYZ]RANGE property takes precedence over this property.
[XYZ]SUBTICKLEN
Set this keyword to a floating-point scale ratio specifying the length of minor tick marks relative to the length of major tick marks. The default is 0.5, specifying that the minor tick mark is one-half the length of the major tick mark. ZSUBTICKLEN is for three-dimensional plots only.
[XYZ]TEXT_COLOR
Set this keyword to an RGB value specifying the color for the axis text. The default value is [0, 0, 0] (black). ZTEXT_COLOR is for three-dimensional plots only.
[XYZ]TEXTPOS
Set this keyword to control the position of axis text labels, including tick mark data values and axis titles. Possible values are:
|
0
|
Position text below a horizontal axis, or to the left of a vertical axis. This is the default.
|
| 1
|
Position text above a horizontal axis, or to the right of a vertical axis.
|
Note: The Z axis is treated as a vertical axis.
See [XYZ]TICKDIR to control the direction of axis tick marks.
[XYZ]TICKDIR
Set this keyword to control the direction of axis tick marks. Possible values are:
|
0
|
Draw the tick marks facing inwards.
For horizontal axes, this sets the TICKDIR property of the bottom axis to 0 and TICKDIR property of the top axis to 1.
For vertical axes, this sets the TICKDIR property of the left axis to 0 and TICKDIR property of the right axis to1.
This is the default.
|
|
1
|
Draw the tick marks facing outwards.
For horizontal axes, this sets the TICKDIR property of the bottom axis to 1and TICKDIR property of the top axis to 0.
For vertical axes, this sets the TICKDIR property of the left axis to 1 and TICKDIR property of the right axis to 0.
|
Note: The Z axis is treated as a vertical axis.
See [XYZ]TEXTPOS to control the position of tick mark data values and axis titles.
[XYZ]TICKFONT_INDEX
Set this keyword equal to one of the following integers, which represent the type of font to be used for the axis text:
- 0 = Helvetica
- 1 = Courier
- 2 = Times
- 3 = Symbol
- 4 = Hershey
ZTICKFONT_INDEX is for three-dimensional plots only.
Tip: Available fonts also include any additional TrueType fonts available to IDL. Instead of using the [XYZ]TICKFONT_INDEX keyword, to access these additional fonts you may wish to create an iTools Style that sets the desired font for your axes.
[XYZ]TICKFONT_SIZE
Set this keyword to a floating-point integer representing the point size of the font used for the axis text. The default is 12.0 points. ZTICKFONT_SIZE is for three-dimensional plots only.
[XYZ]TICKFONT_STYLE
Set this keyword equal to one of the following integers, which represent the style of font to be used for the axis text:
- 0 = Normal
- 1 = Bold
- 2 = Italic
- 3 = Bold Italic
ZTICKFONT_STYLE is for three-dimensional plots only.
[XYZ]TICKFORMAT
Set this property to a string which represents a format string or the name of a function to be used to format the tick mark labels. TICKFORMAT can also be set to an array of format strings for each tick mark. If an array is provided, each string corresponds to a level of the axis. The TICKUNITS keyword determines the number of levels for an axis.
If the string begins with an open parenthesis, it is treated as a standard format string. If the string does not begin with an open parenthesis, it is interpreted as the name of a callback function to be used to generate tick mark labels. This function is defined with either three or four parameters, depending on whether TICKUNITS is specified.
If TICKUNITS are not specified:
- The callback function is called with three parameters: Axis, Index, and Value, where:
- Axis is the axis number: 0 for X axis, 1 for Y axis, 2 for Z axis
- Index is the tick mark index (indices start at 0)
- Value is the data value at the tick mark (a double-precision floating point value)
If TICKUNITS are specified:
The callback function is called with four parameters: Axis, Index, Value, and Level, where:
- Axis, Index, and Value are the same as described above.
- Level is the index of the axis level for the current tick value to be labeled. (Level indices start at 0.)
ZTICKFORMAT is for three-dimensional plots only.
[XYZ]TICKINTERVAL
Set this keyword to a floating-point scalar indicating the interval between major tick marks for the first axis level. The default value is computed according to the axis [XYZ]RANGE and the number of major tick marks ([XYZ]MAJOR). The value of this keyword takes precedence over the value set for the [XYZ]MAJOR keyword.
For example, if TICKUNITS = ['S', 'H', 'D'], and TICKINTERVAL = 30, then the interval between major ticks for the first axis level will be 30 seconds.
ZTICKINTERVAL is for three-dimensional plots only.
[XYZ]TICKLAYOUT
Set this keyword to integer scalar that indicates the tick layout style to be used to draw each level of the axis.
Valid values include:
- 0 = The axis line, major tick marks and tick labels are all included. Minor tick marks only appear on the first level of the axis. This is the default tick layout style.
- 1 = Only the labels for the major tick marks are drawn. The axis line, major tick marks, and minor tick marks are omitted.
- 2 = Each major tick interval is outlined by a box. The tick labels are positioned within that box (left-aligned). For the first axis level only, the major and minor tick marks will also be drawn.
ZTICKLAYOUT is for three-dimensional plots only.
Note: For all tick layout styles, at least one tick label will appear on each level of the axis (even if no major tick marks fall along the axis line). If there are no major tick marks, the single tick label will be centered along the axis.
[XYZ]TICKLEN
Set this keyword to a floating-point value that specifies the length of each major tick mark, measured in data units. The recommended, and default, tick mark length is 0.2. IDL converts, maintains, and returns this data as double-precision floating-point. ZTICKLEN is for three-dimensional plots only.
[XYZ]TICKNAME
Set this keyword to a string array containing the tick mark labels. ZTICKNAME is for three-dimensional plots only.
[XYZ]TICKUNITS
Set this keyword to a string (or a vector of strings) indicating the units to be used for axis tick labeling. If more than one unit is provided, the axis will be drawn in multiple levels, one level per unit.
The order in which the strings appear in the vector determines the order in which the corresponding unit levels will be drawn. The first string corresponds to the first level (the level nearest to the primary axis line).
Valid unit strings include:
- "Numeric"
- "Years"
- "Months"
- "Days"
- "Hours"
- "Minutes"
- "Seconds"
- "Time" - Use this value to indicate that the tick values are time values; IDL will determine the appropriate time intervals and tick label formats based upon the range of values covered by the axis.
- ""- Use the empty string to indicate that no tick units are being explicitly set. This implies that a single axis level will be drawn using the "Numeric" unit. This is the default setting.
If any of the time units are utilized, then the tick values are interpreted as Julian date/time values. Note that the singular form of each of the time value strings is also acceptable (e.g, TICKUNITS = 'Day' is equivalent to TICKUNITS = 'Days').
ZTICKUNITS is for three-dimensional plots only.
Note: Julian values must be in the range -1095 to 1827933925, which corresponds to calendar dates 1 Jan 4716 B.C.E. and 31 Dec 5000000 C.E., respectively.
[XYZ]TICKVALUES
Set this keyword to a floating-point vector of data values representing the values at each tick mark. If TICKVALUES is set to 0, the default, IDL computes the tick values based on the axis range and the number of major ticks. IDL converts, maintains, and returns this data as double-precision floating-point. ZTICKVALUES is for three-dimensional plots only.
[XYZ]TITLE
Set this keyword to a string representing the title of the specified axis. ZTITLE is for three-dimensional plots only.
ZOOM_ON_RESIZE
Set this keyword to 1 (True) so that visualizations change size when the window is resized. The default value is 0 (False), which ensures that visualizations remain the same size regardless of the window dimensions.
Map Projection Keywords
MAP_PROJECTION
Set this keyword to a string specifying the name of an IDL GCTP map projection to use for the initial projection. Available projections include:
|
Alaska Conformal
Albers Equal Area
Azimuthal Equidistant
Cylindrical Equal Area
Equidistant Conic
Equirectangular
Geographic
Gnomonic
Hammer
Hotine Oblique Mercator
Integerized Sinusoidal
|
Interrupted Goode
Interrupted Mollweide
Lambert Azimuthal
Lambert Conformal Conic
Mercator
Miller Cylindrical
Mollweide
Near Side Perspective
Oblated Equal Area
Orthographic
Polar Stereographic
|
Polyconic
Robinson
Sinusoidal
Space Oblique Mercator
State Plane
Stereographic
Transverse Mercator
UTM
Van der Grinten
Wagner IV
Wagner VII |
Each of the above map projections requires other keywords to define the projection. The following keywords are available:
|
CENTER_AZIMUTH
CENTER_LATITUDE
CENTER_LONGITUDE
ELLIPSOID
FALSE_EASTING
FALSE_NORTHING
HEIGHT
HOM_AZIM_ANGLE
HOM_AZIM_LONGITUDE
HOM_LATITUDE1
HOM_LATITUDE2
HOM_LONGITUDE1
HOM_LONGITUDE2 |
IS_JUSTIFY
IS_ZONES
LIMIT
MERCATOR_SCALE
OEA_ANGLE
OEA_SHAPEM
OEA_SHAPEN
SAT_TILT
SEMIMAJOR_AXIS
SEMIMINOR_AXIS
SOM_FLAG
|
SOM_INCLINATION
SOM_LANDSAT_NUMBER
SOM_LANDSAT_PATH
SOM_LONGITUDE
SOM_PERIOD
SOM_RATIO
SPHERE_RADIUS
STANDARD_PAR1
STANDARD_PAR2
STANDARD_PARALLEL
TRUE_SCALE_LATITUDE
ZONE
|
See the table of GCTP map projections within the MAP_PROJ_INIT function for descriptions of these keywords.
IIMAGE Keywords Accepted
See IIMAGE for the description of the following keywords:
ALPHA_CHANNEL, BLUE_CHANNEL, CHANNEL, CLIP_PLANES, GREEN_CHANNEL, GRID_UNITS, HIDE, IMAGE_DIMENSIONS, IMAGE_LOCATION, INTERPOLATE, ORDER, RED_CHANNEL, RGB_TABLE, ZVALUE
ICONTOUR Keywords Accepted
CONTOUR
Set this keyword to create a contour visualization from the supplied data. By default, the procedure creates an image visualization.
See ICONTOUR for the description of the following keywords:
AM_PM, ANISOTROPY, C_COLOR, C_FILL_PATTERN, C_LABEL_INTERVAL, C_LABEL_NOGAPS, C_LABEL_OBJECTS, C_LABEL_SHOW, C_LINESTYLE, C_THICK, C_USE_LABEL_COLOR, C_USE_LABEL_ORIENTATION, C_VALUE, CLIP_PLANES, COLOR, DAYS_OF_WEEK, DEPTH_OFFSET, DOWNHILL, FILL, GRID_UNITS, HIDE, LABEL_FONT, LABEL_FORMAT, LABEL_FRMTDATA, LABEL_UNITS, MAX_VALUE, MIN_VALUE, MONTHS, N_LEVELS, PLANAR, RGB_INDICES, RGB_TABLE, SHADE_RANGE, SHADING, TICKINTERVAL, TICKLEN, USE_TEXT_ALIGNMENTS, ZVALUE
Examples
In the IDL Intelligent Tools system, data can be imported from the IDL Command Line (as described in Examples 2 and 3) or data can be imported via the File menu in the iTool window.
Example 1
IMAP, MAP_PROJECTION='Lambert'
This command opens a new iMap tool with the Lambert Conformal Conic projection loaded.
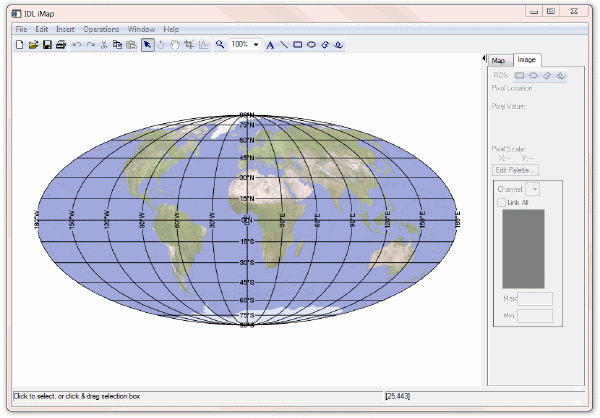
Example 2
file = FILEPATH('avhrr.png', SUBDIRECTORY=['examples','data'])
data = READ_PNG(file, r, g, b)
IMAP, data, LIMIT=[-90,-180,90,180], $
MAP_PROJECTION='Mollweide', RGB_TABLE=[[r],[g],[b]], $
IMAGE_TRANSPARENCY=50, GRID_UNITS=2, $
IMAGE_LOCATION=[-180,-90], IMAGE_DIMENSIONS=[360,180]
This series of commands opens a new iMap tool and loads an image of the world, registered in degrees, into a Mollweide map projection.
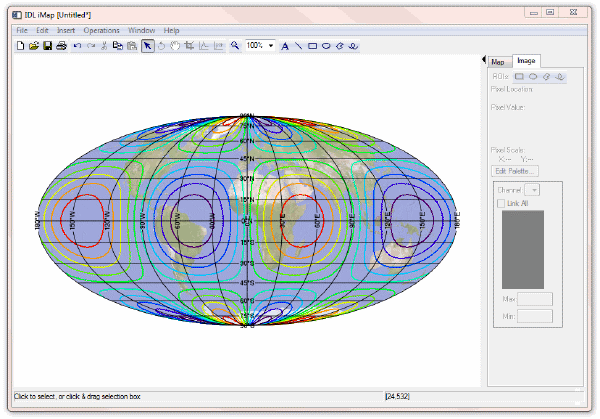
Example 3
This example builds on Example 2, adding contours to the world image in the Mollweide projection.
clons = FINDGEN(360) - 179.5
clats = FINDGEN(180) - 89.5
cdata = SIN(clons/30) # COS(clats/30)
IMAP, cdata, clons, clats, /CONTOUR, /OVERPLOT, $
RGB_TABLE=39, GRID_UNITS=2, $
N_LEVELS=10, C_THICK=REPLICATE(2,10)
This series of commands plots the contour data atop Example 2’s display .
Example 4
This example uses IMAP with the GEOTIFF keyword to visualize a TIFF image with embedded GEOTIFF metadata.
dataFilePath = FILEPATH('boulder.tif', $
SUBDIR=['examples','data'])
data_variable=READ_TIFF(dataFilePath, GEOTIFF=GeoKeys)
Note: You can also open image files using File > Open File or using the IOPEN command. If you use File > Open File, IDL defines the variable names. If you use IOPEN, you define the names of the data and GeoTIFF variables.
You can view the structure of the GeoKeys variable that holds the geotiff structure by looking at the Variables view or by typing the following at the command line.
HELP, GeoKeys, /STRUCTURE
Now you can visualize the image with the GeoTIFF information using the GEOTIFF keyword with IMAP:
IMAP, data_variable, GEOTIFF=GeoKeys
Version History
|
6.1 |
Introduced |
|
6.2 |
Added DISPLAY_SPLASH_SCREEN and VIEW_TITLE keywords
|
|
6.4 |
Added the ANISTROPIC_SCALE_2D, ANISTROPIC_SCALE_3D, FIT_TO_VIEW, GEOTIFF, RENDERER, SCALE_ISOTROPIC, VIEW_ZOOM keywords.
|
|
7.1 |
Deprecated the DATUM keyword
Added the ELLIPSOID keyword
Added the Filename argument.
Added the FONT_COLOR, FONT_NAME, FONT_SIZE, FONT_STYLE, WINDOW_TITLE, CURRENT_ZOOM, DEPTHCUE_BRIGHT, DEPTHCUE_DIM, STRETCH_TO_FIT, XMARGIN, YMARGIN, and ZOOM_ON_RESIZE keywords.
Modified behavior of the TITLE keyword to create a text annotation along with the visualization.
|
| 8.0
|
Added AXIS_STYLE, DEVICE, NORMAL, POSITION, [XYZ]TEXTPOS, [XYZ]TICKDIR, LAYOUT, MARGIN keywords.
Deprecated XMARGIN, YMARGIN keywords.
|
| 8.1
|
Added ASPECT_RATIO, ASPECT_Z, [XYZ]STYLE.
Deprecated ANISOTROPIC_SCALE_2D, ANISOTROPIC_SCALE_3D, SCALE_ISOTROPIC keywords.
|