The POLYLINE function plots a series of lines as an annotation to an existing IDL graphic.
Example
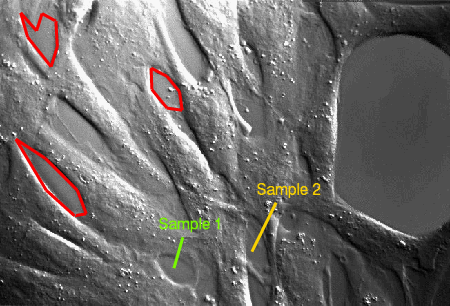
The following lines create the plot shown at the top of this topic.
im = IMAGE(FILEPATH('muscle.jpg', $
SUBDIRECTORY=['examples','data']))
line1 = POLYLINE([265,252], [100,55], /DATA, $
TARGET=im, COLOR=!COLOR.CHARTREUSE, THICK=3)
line2 = POLYLINE([400,365], [150,79], /DATA, $
TARGET=im, COLOR=!COLOR.GOLD, THICK=3)
t1 = TEXT(230,110,'Sample 1', /DATA, TARGET=im, $
COLOR=!COLOR.CHARTREUSE)
t2 = TEXT(372,160,'Sample 2', /DATA, TARGET=im, $
COLOR=!COLOR.GOLD)
x = [23,67,108,125,112,66,219,220,242,264,260,242,30,40, $
74,83,81,61,53]
y = [242,168,131,134,168,214,345,314,287,284,311,333,425, $
390,347,376,413,424,399]
conn = [7,0,1,2,3,4,5,0,7,6,7,8,9,10,11,6,8,12,13,14,15, $
16,17,18,12]
line3 = POLYLINE(x, y, CONNECTIVITY=conn, $
COLOR=!COLOR.red, THICK=3, /DATA)
Additional Examples
See Annotations examples for additional examples using the POLYLINE function.
Syntax
graphic = POLYLINE(X, Y, [, Z] [, Format] [, CONNECTIVITY=array] [, /DATA] [, /DEVICE] [, /NORMAL] [, TARGET=variable] [, Properties=value])
Keywords
[, CONNECTIVITY=array] [, /DATA] [, /DEVICE] [, /NORMAL] [, /RELATIVE] [, TARGET=variable]
Properties
Properties can be set as keywords to the function during creation, or retrieved or changed using the "." notation after creation.
ANTIALIAS, CLIP, COLOR, HIDE, LINESTYLE, NAME, POSITION, THICK, TRANSPARENCY, UVALUE, WINDOW
Methods
Close
ConvertCoord
CopyWindow
Delete
Erase
GenerateCode
GetData
GetValueAtLocation
MapForward
MapInverse
Order
Print
Refresh
Rotate
Save
Scale
Select
SetData
Translate
Note: The GetValueAtLocation method is not supported for POLYLINE.
Return Value
The POLYLINE function returns a reference to the created annotation. Use the returned reference to manipulate the annotation after creation by changing properties or by calling methods.
Arguments
X
Y
Z
The vertices of the polyline. The vectors X, Y, [and Z] must be of equal length. Unless Z is specified, a 2-D polyline is created.
Format
A string that sets line format properties using short tokens to represent color, linestyle, and thickness values. For example, to create a solid red line with a thickness value of 2, you would use the following:
p = POLYLINE(x, y, '-r2')
Tokens in the Format string represent values of the LINESTYLE, COLOR, and THICK properties. From one to three tokens can be present, and the tokens may be in any order. Tokens are case sensitive. For more information about the syntax of the Format argument, see Formatting IDL Graphics Symbols and Lines.
Keywords
Keywords are applied only during the initial creation of the graphic.
CONNECTIVITY
A vector defining individual polylines of the form: [n, i0, i1, ..., in-1, n, i0, i1, ..., in-1], where n is the number of vertices that define a polyline, and i0..in-1 are indices into a polyline vertex list. Connectivity allows you to insert multiple polylines with a single call. All of the polylines will share the same properties.
DATA
Set this keyword to 1 if the input arguments are specified in data coordinates. Setting this keyword inserts the polyline into the data space, otherwise the polyline is added to the annotation layer.
DEVICE
Set this keyword if values are specified in device coordinates (pixels) for the MARGIN and POSITION properties. (Normalized coordinates are the default for these properties.)
NORMAL
Set this keyword to 1 if the input arguments are specified in normalized ( [0, 1] ) coordinates (the default).
RELATIVE
Set this keyword to indicate that the input arguments are specified in normalized [0,1] coordinates, relative to the axis range of the TARGET's dataspace. If the TARGET keyword is not specified, then setting /RELATIVE is the same as setting /NORMAL.
Note: When using /RELATIVE, even though the coordinates are relative to the TARGET's dataspace, the graphic is added to the annotation layer, not to the dataspace.
TARGET
Set this keyword to the graphic object to use if points are specified in data coordinates. By default, the current graphic is used.
Properties
ANTIALIAS
By default anti-aliasing is used when drawing lines. Set this property to 0 to disable anti-aliasing.
CLIP
Set this property to 1 to clip portions of the graphic that lie outside of the dataspace range, or to 0 to disable clipping. The default is 1. This property is ignored unless the DATA property is set.
COLOR
Set this property to a string or RGB vector that specifies the color of the polyline. The default is "black".
HIDE
Set this property to 1 to hide the graphic. Set HIDE to 0 to show the graphic.
LINESTYLE
Set this property to an integer or string specifying the line style for the polyline.
The following table lists the index values, strings, and characters you can use with the LINESTYLE property, and the equivalent characters and strings you can use in the Format string argument.
|
Index |
LINESTYLE Property
|
Format Argument |
Description |
|
0 |
'solid_line', '-'(dash)
|
'-' (dash) |
solid line |
|
1 |
'dot', ':'(colon)
|
':'(colon) |
dotted |
|
2 |
'dash', '--' (double dashes)
|
'--' (double dashes)
|
dashed |
|
3 |
'dash_dot', '-.'
|
'-.' |
dash dot |
|
4 |
'dash_dot_dot_dot', '-:'
|
'-:' |
dash dot dot dot
|
|
5 |
'long_dash', '__' (two underscores)
|
'__' (double underscores)
|
long dash |
|
6 |
'none', ' ' (space)
|
' ' (space) |
no line |
Note: If you use the LINESTYLE value or Format string '-.', the linestyle is set to dash-dot and the plot symbol is not set.
Note: You can also set LINESTYLE to a two-element vector, [repeat, bitmask], specifying a stippling pattern. The repeat indicates the number of times that individual bits in the bitmask should be repeated. (That is, if three consecutive 0’s appear in the bitmask and the value of repeat is 2, then the line that is drawn will have six consecutive bits turned off.) The value of repeat must be an integer between 1 and 255. The bitmask indicates which pixels are drawn and which are not along the length of the line. The bitmask should be specified as a 16-bit hexadecimal value. For example, LINESTYLE = [2, 'F0F0'X] describes a dashed line (8 bits on, 8 bits off, 8 bits on, 8 bits off).
NAME
A string that specifies the name of the graphic. The name can be used to retrieve the graphic using the brackets array notation. If NAME is not set then a default name is chosen based on the graphic type.
POSITION
Set this property to a two or four-element vector that determines the position of the graphic within the window. If two elements are provided, the center of the graphic will be translated to that position. For four elements, the coordinates [X1, Y1, X2, Y2] define the lower left and upper right corners of the graphic. Coordinates are expressed in normalized units ranging from 0.0 to 1.0. On creation, if the DEVICE keyword is set, the units are given in device units (pixels).
THICK
Set this property to a value between 0 and 10 that specifies the thickness of the polyline. A thickness of 0 displays a thin hairline on the chosen device. The default value is 1.
TRANSPARENCY
An integer between 0 and 100 that specifies the percent transparency of the polyline. The default value is 0.
UVALUE
Set this property to an IDL variable of any data type.
WINDOW (Get Only)
This property retrieves a reference to the WINDOW object which contains the graphic.
Version History
|
8.0 |
Introduced |
|
8.1 |
Added the UVALUE property
The THICK property was changed to accept a value between 0 and 10
Added the following methods: Delete, GetData, SetData
|
|
8.2.2 |
Added POSITION property.
|
|
8.2.3 |
Added the ability to use a stippling pattern for LINESTYLE.
|
See Also
!COLOR, Formatting IDL Graphics Symbols and Lines, PLOT, POLYGON, Using IDL graphics