The HIST_EQUAL function returns a histogram-equalized byte array.
The HISTOGRAM function is used to obtain the density distribution of the input array. The histogram is integrated to obtain the cumulative density-probability function and finally the lookup function is used to transform to the output image. When used in image processing, HIST_EQUAL is often used to enhance contrast within an image (see Additional Examples).
Note: The first element of the histogram is always zeroed to remove the background.
This routine is written in the IDL language. Its source code can be found in the file hist_equal.pro in the lib subdirectory of the IDL distribution.
Example
Create a sample image using the DIST function and display it:
myImage = DIST(100)
TV, myImage
Create a histogram-equalized version of the byte array, image, and display the new version. Use a minimum input value of 10, a maximum input value of 200, and limit the top value of the output array to 220:
newImage = HIST_EQUAL(myImage, MINV=10, MAXV=200, TOP=220)
TV, newImage
For a more detailed example of using HIST_EQUAL to enhance an image, see Additional Examples at the bottom of this topic.
See “Working with Histograms” (Chapter 8, Image Processing in IDL) in the help/pdf directory of the IDL installation.
Syntax
Result = HIST_EQUAL( A [, BINSIZE=value] [, FCN=vector] [, /HISTOGRAM_ONLY] [, MAXV=value] [, MINV=value] [, OMAX=variable] [, OMIN=variable] [, PERCENT=value] [, TOP=value] )
Return Value
This function returns a histogram-equalized array of type byte, with the same dimensions as the input array. If the HISTOGRAM_ONLY keyword is set, then the output will be a vector of type LONG.
Arguments
A
The array to be histogram-equalized.
Keywords
BINSIZE
Set this keyword to the size of the bin to use. The default is BINSIZE=1 if A is a byte array, or, for other input types, the default is (MAXV – MINV)/5000.
FCN
Set this keyword to the desired cumulative probability distribution function in the form of a 256-element vector. If a probability distribution function is not supplied, IDL uses a linear ramp, which yields equal probability bin results. This function is later normalized, so magnitude is inconsequential; the function should, however, increase monotonically.
HISTOGRAM_ONLY
Set this keyword to return a vector of type LONG containing the cumulative distribution histogram, rather than the histogram equalized array.
MAXV
Set this keyword to the maximum value to consider. The default is 255 if A is a byte array, otherwise the maximum data value is used. Input elements greater than or equal to MAXV are output as 255.
MINV
Set this keyword to the minimum value to consider. The default is 0 if A is a byte array, otherwise the minimum data value is used. Input elements less than or equal to MINV are output as 0.
OMAX
Set this keyword to a named variable that, upon exit, will contain the maximum data value used in constructing the histogram.
OMIN
Set this keyword to a named variable that, upon exit, will contain the minimum data value used in constructing the histogram.
PERCENT
Set this keyword to a value between 0 and 100 to stretch the image histogram. The histogram will be stretched linearly between the limits that exclude the PERCENT fraction of the lowest values, and the PERCENT fraction of the highest values. This is an automatic, semi-robust method of contrast enhancement.
TOP
The maximum value of the scaled result. If TOP is not specified, 255 is used. Note that the minimum value of the scaled result is always 0.
Additional Examples
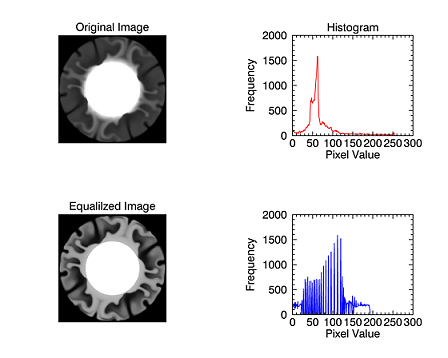
This example shows the use of the HIST_EQUAL function to enhance the contrast in an image. Copy and paste the following lines to the IDL command line to run them:
file = FILEPATH('convec.dat', SUBDIR=['examples','data'])
mantle = READ_BINARY(file, DATA_DIMS=[248,248])
orig = IMAGE(mantle, $
LAYOUT=[2,2,1], $
TITLE='Original Image', $
WINDOW_TITLE='Histogram Equalization Example')
orig_histogram = HISTOGRAM(mantle)
hist = PLOT(orig_histogram, $
LAYOUT=[2,2,2], $
/CURRENT, $
COLOR='red', $
MAX_VALUE=5e3, $
XTITLE='Pixel value', $
YTITLE='Frequency', $
TITLE='Histogram')
equ_mantle = HIST_EQUAL(mantle)
equ = IMAGE(equ_mantle, $
LAYOUT=[2,2,3], $
/CURRENT, $
TITLE='Equalized Image')
equ_histogram = HISTOGRAM(equ_mantle)
equ_hist = PLOT(equ_histogram, $
LAYOUT=[2,2,4], $
/CURRENT, $
COLOR='blue', $
MAX_VALUE=5e3, $
XTITLE='Pixel value', $
YTITLE='Frequency', $
TITLE='Histogram')
The resulting image before and after processing through histogram equalization. Note the increase in contrast in the second image, and the wider spread of pixel values in the second histogram (after equalization).
Version History
See Also
ADAPT_HIST_EQUAL, H_EQ_CT, H_EQ_INT, HIST_2D, HISTOGRAM