The VECTOR function draws a plot of either vectors or wind barbs. The vectors or wind barbs are input using two arrays that specify the horizontal and vertical components (in arbitrary units). You can also specify the X and Y locations for the vectors or wind barbs.
Tip: The LEGEND function may be used to add a "sample" vector of a given length to a vector plot.
Tip: The purpose of the VECTOR function is to draw a vector field or wind field at a series of (X, Y) locations. The units of the vector or wind field are arbitrary, and are not related to the units for the X and Y coordinates. The ARROW function (with the DATA keyword) may be used to draw arrows that are directly related to the X and Y coordinates.
Example
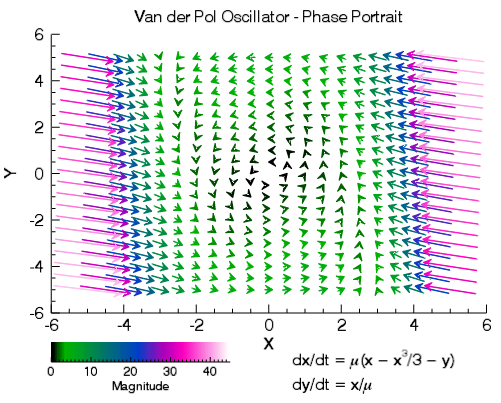
The following lines create the graphic shown at the right.
n = 21
x = 10*DINDGEN(n)/(n-1) - 5
y = 10*DINDGEN(n)/(n-1) - 5
xx = REBIN(x, n, n)
yy = REBIN(TRANSPOSE(y), n, n)
mu = 1
xdot = mu*(xx - xx^3/3 - yy)
ydot = xx/mu
v = VECTOR(xdot, ydot, x, y, $
AUTO_COLOR=1, AUTO_RANGE=[0,45], $
RGB_TABLE=10, $
POSITION=[0.10,0.22,0.95,0.9], $
XTITLE='X', YTITLE='Y', $
TITLE='Van der Pol Oscillator - Phase Portrait')
v.ARROW_THICK = 2
v.LENGTH_SCALE = 2
c = COLORBAR(TARGET=v, $
POSITION=[0.10,0.1,0.45,0.15], $
TITLE='Magnitude')
t = TEXT(0.57, 0.09, 'dx/dt = $\mu(x - x^3/3 - y)$')
t = TEXT(0.57, 0.03, 'dy/dt = $x/\mu$')
Additional Examples
See Surface, contour, and vector examples for additional examples using the VECTOR function.
Syntax
graphic = VECTOR(U, V, [, X, Y ] [, Keywords=value] [, Properties=value])
Keywords
Keywords are applied only during the initial creation of the graphic.
AXIS_STYLE=value
/BUFFER, /CURRENT, /DEVICE, DIMENSIONS=[width, height], DRAG_QUALITY=quality, LAYOUT=array, LOCATION=[x, y], MARGIN=scalar or [left, bottom, right, top], /NO_TOOLBAR, /NODATA, /OVERPLOT, /WIDGETS
Properties
Properties can be set as keywords to the function during creation, or retrieved or changed using the "." notation after creation.
ANTIALIAS, ARROW_STYLE, ARROW_THICK, ASPECT_RATIO, AUTO_COLOR, AUTO_RANGE, AUTO_SUBSAMPLE, AXES, BACKGROUND_COLOR, BACKGROUND_TRANSPARENCY, CLIP, COLOR, CROSSHAIR, DATA_LOCATION, DIRECTION_CONVENTION, FONT_COLOR, FONT_NAME, FONT_SIZE, FONT_STYLE, GRID_UNITS, HEAD_ANGLE, HEAD_INDENT, HEAD_PROPORTIONAL, HEAD_SIZE, HIDE, LENGTH_SCALE, MAPGRID, MAPPROJECTION, MAP_PROJECTION, MAX_VALUE, MIN_VALUE, NAME, POSITION, RGB_TABLE, SUBSAMPLE_METHOD, SYMBOL, SYM_COLOR, SYM_FILLED, SYM_FILL_COLOR, SYM_OBJECT, SYM_SIZE, SYM_THICK, SYM_TRANSPARENCY, THICK, TITLE, TRANSPARENCY, USE_DEFAULT_COLOR, UVALUE, VECTOR_COLORS, VECTOR_STYLE, WINDOW, WINDOW_TITLE, X_SUBSAMPLE, Y_SUBSAMPLE, XRANGE, YRANGE, ZVALUE
Methods
Close
ConvertCoord
CopyWindow
Delete
Erase
GenerateCode
GetData
GetValueAtLocation
MapForward
MapInverse
Order
Print
Refresh
Rotate
Save
Scale
Select
SetData
Translate
Return Value
The VECTOR function returns a reference to the created graphic. Use the returned reference to manipulate the graphic after creation by changing properties or calling methods.
Arguments
U
A one or two-dimensional array containing the horizontal components of the vectors. If the X and Y arguments are provided, the vectors are plotted as a function of the (x, y) locations. Otherwise, the vectors are plotted as a function of the two-dimensional array index of each element of U.
Note: If U and V are one-dimensional arrays then the vectors are assumed to lie on an irregular grid, and you must specify the X and Y locations.
Note: The units for the U and V components are arbitrary, and are not related to the units of the X and Y coordinates. The VECTOR function will compute a default length scale and head size based upon the overall number of vectors and the average magnitude of the vectors. The LENGTH_SCALE and HEAD_SCALE properties may be used to change the default size.
V
A one or two-dimensional array containing the vertical components of the vectors. V must have the same dimensions as U.
X
A one-dimensional array specifying the x-coordinates for the vectors. If U is a two-dimensional array then X must have the same number of elements as the first dimension of U, where each element of X specifies the x-coordinate for a column of U. If U is a one-dimensional array then X must have the same number of elements as U, where each element of X specifies the x-coordinate for the corresponding element of U.
Y
A one-dimensional array specifying the y-coordinates for the vectors. If U is a two-dimensional array then Y must have the same number of elements as the second dimension of U, where each element of Y specifies the y-coordinate for a row of U. If U is a one-dimensional array then Y must have the same number of elements as U, where each element of Y specifies the y-coordinate for the corresponding element of U.
Keywords
Keywords are applied only during the initial creation of the graphic.
AXIS_STYLE
Set this keyword to one of the following values:
- 0 - No axes. Decrease the margins so the graphic almost fills the window. This is the default for images.
- 1 - Single X, Y (and Z if 3D) axes located at the minimum data value. The margins will be adjusted to leave space for the axes. This is the default for 3D graphics.
- 2 - Box axes - multiple axes located at both the minimum and maximum data values. The margins will be adjusted to leave space for the axes. This is the default for 2D graphics.
- 3 - Crosshair-style axes - located at the midpoint of each data dimension. Since the axes are in the middle, decrease the margins so the graphic almost fills the window. This is the default for polar plots.
- 4 - No axes, but use the same margins as if axes were there. This is useful if you want to later add another graphic that does have axes, and you want the two visualizations to be aligned properly.
You can set the following properties on the axes:
|
Property |
Description |
|
[XYZ]COLOR |
A string or RGB vector containing the axis color.
|
|
[XYZ]GRIDSTYLE |
A string, integer, or 2-element vector giving the linestyle for tickmarks.
|
|
[XYZ]LOG |
Set to 1 if the axis is logarithmic. The minimum value of the axis range must be greater than zero.
|
|
[XYZ]MAJOR |
The number of major tick marks. Set to -1 to auto-compute, set to 0 to suppress.
|
|
[XYZ]MINOR |
The number of minor tick marks. Set to -1 to auto-compute, set to 0 to suppress.
|
|
[XYZ]SUBGRIDSTYLE
|
A string, integer, or 2-element vector giving the linestyle for the minor tickmarks. The default is 0, for solid lines. Set to -1 to force minor ticks to have the same linestyle as major ticks.
|
|
[XYZ]SHOWTEXT |
Set to 1 to show text labels or 0 to hide the text labels.
|
|
[XYZ]STYLE |
The axis range style. The valid values are:
(0) Nice range. Default for all graphics except Image, Barplot, and Map.
(1) Force the exact data range. Default for Image, Barplot, and Map.
(2) Pad the axes slightly beyond the nice range.
(3) Pad the axes slightly beyond the exact data range.
The [XYZ]RANGE takes precedence over this property.
|
|
[XYZ]SUBTICKLEN |
The ratio of the minor tick length to the major tick length. The default is 0.5.
|
|
[XYZ]TEXT_COLOR |
A string or RGB vector containing the axis text color.
|
|
[XYZ]TEXT_ORIENTATION
|
The angle (in degrees) of the tick mark labels.
|
|
[XYZ]TEXTPOS |
Set to 1 to position text above the axis. The default is 0, below the axis.
|
|
[XYZ]THICK |
Set to a floating-point value between 0 and 10 to specify the line thickness for tickmarks. A thickness of 0 gives a thin hairline. The default is 1.
|
|
[XYZ]TICKDIR |
Set to 1 to draw the tickmarks facing outwards. The default is 0, facing inwards.
|
|
[XYZ]TICKFONT_NAME
|
A string containing the font name for the axis text.
|
|
[XYZ]TICKFONT_SIZE
|
The axis text size in points.
|
|
[XYZ]TICKFONT_STYLE
|
A string or integer containing the font style: normal (0), bold (1), italic (2), or bold italic (3).
|
|
[XYZ]TICKFORMAT |
A string or string array of tick label formats. See Format Codes for more information.
|
|
[XYZ]TICKINTERVAL
|
The interval between major tick marks.
|
|
[XYZ]TICKLAYOUT |
Set to 1 to suppress tick marks; set to 2 to draw a box around the tick labels.
|
|
[XYZ]TICKLEN |
The length of each major tick mark, normalized to the width or height of the graphic. The default value is automatically calculated based upon the aspect ratio of the graphic.
|
|
[XYZ]TICKNAME |
A string array containing the tick labels.
|
|
[XYZ]TICKUNITS |
A string giving the tick units. Valid values are: null (the default, signified by empty quotes), Years, Months, Days, Hours, Minutes, Seconds, Time, exponent for exponential notation, or scientific for scientific notation.
If any of the time units are utilized, then the tick values are interpreted as Julian date/time values. If more than one unit is provided, the axis will be drawn with multiple levels.
|
|
[XYZ]TICKVALUES |
An array of tick mark locations.
|
|
[XYZ]TITLE |
A string giving the axis title.
|
|
[XYZ]TRANSPARENCY
|
An integer from 0-100 giving the percent transparency.
|
For more detailed explanations of these properties, see the AXIS function.
Tip: You can also use the AXIS function to insert additional axes after the graphic has been created.
BUFFER
Set this keyword to 1 to direct the graphics to an off-screen buffer instead of creating a window.
CURRENT
Set this keyword to create the graphic in the current window with a new set of axes. If no window exists, a new window is created. The WINDOW's SetCurrent method may be used to set the current window.
Or, set this keyword to an existing IDL Graphic reference to make that window be the current window and direct the new graphic to that window.
Tip: The CURRENT keyword is usually used with the LAYOUT keyword or POSITION property to produce a window which has multiple graphics in different locations.
Tip: For the graphic share the same axes as an existing graphic, use the OVERPLOT keyword instead.
DEVICE
Set this keyword if values are specified in device coordinates (pixels) for the MARGIN and POSITION keywords. (Normalized coordinates are the default for these keywords.)
DIMENSIONS
Set this keyword to a two-element vector of the form [width, height] to specify the window dimensions in pixels. If you do not specify a value for DIMENSIONS, IDL by default uses the values of the IDL_GR_WIN_HEIGHT and IDL_GR_WIN_WIDTH preferences for Windows platforms or the IDL_GR_X_HEIGHT and IDL_GR_X_WIDTH preferences for X Windows systems on UNIX.
Tip: The minimum width is set by the toolbar in the window, usually around 400 pixels. To create a smaller graphics window, use the NO_TOOLBAR keyword.
DRAG_QUALITY
Set this keyword to 0, 1, or 2 to control the rendering quality and performance during moves, transformations, and rotations initiated with the mouse. The default value is 2, which maintains full rendering quality during mouse interactions. Set to 1 to reduce the drawing quality, or to 0 to further reduce or in some cases disable drawing during dragging or resizing.
LAYOUT
Set this keyword to a three-element vector [ncol, nrow, index] that arranges graphics in a grid. The first dimension ncol is the number of columns in the grid, nrow is the number of rows, and index is the grid position at which to place the graphic (starting at element 1). This keyword is ignored if either OVERPLOT or POSITION is specified.
LOCATION
Set this keyword to a two-element vector [X offset, Y offset] giving the window's screen offset in pixels.
MARGIN
Set this keyword to the current graphic’s margin values in the layout specified by the LAYOUT property. Use a scalar value to set the same margin on all sides, or use a four-element vector [left, bottom, right, top] to specify different margins on each side.
By default, margin values are expressed in normalized units ranging from 0.0 to 0.5. If the DEVICE keyword is set, the values are given in device units (pixels).
This keyword is ignored if either OVERPLOT or POSITION is specified.
NO_TOOLBAR
By default the graphics window will have a toolbar containing some common tools such as Print and Save. Set this keyword to remove the toolbar. This keyword has no effect if the window is already created.
Tip: When the toolbar exists, the minimum window width is set to the toolbar's width, usually around 400 pixels. To create a smaller graphics window, use the NO_TOOLBAR keyword.
NODATA
Set this keyword to 1 to create the graphic, but without any data attached to it. The axes and title (if present) are also created and displayed. If the OVERPLOT keyword is specified, axis ranges will not change.
Note: You must still provide valid input arguments. The data range of the input arguments are used to automatically set the range of the axes. The [XYZ]RANGE properties may be used to override these default ranges.
OVERPLOT
Set this keyword to 1 (one) to place the graphic on top of the currently-selected graphic within the current window. The two graphics items will then share the same set of axes. If no current window exists, then this keyword is ignored and a new window is created.
If you have a graphic in another window that is not currently selected, you can also set this keyword to that graphic's reference to overplot on top of that graphic.
Tip: For the graphic to have a new set of axes, use the CURRENT keyword instead.
WIDGETS
By default, when running from the IDL Workbench, the graphics window will use the native widgets for your platform. Set this keyword to instead use IDL widgets for the graphics window. This keyword is ignored when running from the IDL command line, since IDL widgets are always used in that case.
Properties
ANTIALIAS
By default anti-aliasing is used when drawing lines. Set this property to 0 to disable anti-aliasing.
ARROW_STYLE
Set this property to 1 to fill the arrow heads (this is the default). Set this property to 0 to draw the arrow heads as an outline. If wind barbs are displayed then this property is ignored.
ARROW_THICK
Set this property to a value between 1.0 and 10.0, specifying the thickness of the arrow shaft. The default is 1.0 points.
ASPECT_RATIO
A floating point value indicating the ratio of the Y dimension to the X dimension in data units. If this property is set to a nonzero value, the aspect ratio will be preserved as the graphic is stretched or shrunk. The default value is 0 for all graphics except images, meaning that the aspect ratio is not fixed, but is allowed to change as the graphic is stretched or shrunk.
AUTO_COLOR
Set this property to enable or disable automatic coloring of vectors or wind barbs. Possible values are:
- 0 - No automatic colors, or use the vertex colors if VECTOR_COLORS is provided (this is the default).
- 1 - Color according to magnitude, using the current color palette.
- 2 - Color according to direction, using the current color palette.
If AUTO_COLOR is set to 1 or 2 then the VECTOR_COLORS property will be ignored.
Tip: The AUTO_RANGE property may be used to control the scaling from the data range into the 0-255 color table range.
AUTO_RANGE
Set this property to a two-element vector [min, max] giving the data scaling range for the vector color array. If AUTO_COLOR=1 or 2, or if VECTOR_COLORS is provided, then the vector color array is scaled from its original data range into the range 0-255. The AUTO_RANGE property may be used to control the minimum and maximum data values used in this scaling. The default value for AUTO_RANGE is the minimum and maximum values of the vector color array.
AUTO_SUBSAMPLE
Set this property to enable or disable automatic sub-sampling of vectors. If automatic sub-sampling is enabled, then the X and Y sub-sampling factors will change depending upon the current view zoom and axis range. The default is disabled.
AXES (Get Only)
This property retrieves an array that contains all of the AXIS objects within the visualization. For example, for a plot visualization:
p = PLOT(/TEST)
ax = p.AXES
ax[0].TITLE = 'X axis'
ax[1].TITLE = 'Y axis'
ax[2].HIDE = 1
ax[3].HIDE = 1
See AXIS for a list of the available properties.
BACKGROUND_COLOR
Set this property to a string or RGB vector indicating the graphic's background color. The default value is [255, 255, 255] (white). Set this property to a scalar value to remove the background color.
Tip: To set the background color of the entire window, retrieve the window object using the WINDOW property, and set the BACKGROUND_COLOR on the window object.
BACKGROUND_TRANSPARENCY
Set this property to an integer between 0 and 100 giving the percent transparency of the background color. The default is 100 (completely transparent).
Note: If the BACKGROUND_COLOR property is changed, and the current background transparency is 100, then the BACKGROUND_TRANSPARENCY will be automatically set to 0 (opaque) so that you can see the new color.
CLIP
Set this property to 1 to clip portions of the graphic that lie outside of the dataspace range, or to 0 to disable clipping. The default is 1.
COLOR
Set this property to a string or RGB vector that specifies the vector color. The default is "black".
CROSSHAIR (Get Only)
Use this property to retrieve a reference to the Crosshair graphic. All graphics objects within the same set of axes share a single Crosshair graphic. For Plot graphics the default behavior is to display the crosshair when a Mouse_Down event is received. For other graphics the crosshair is disabled. The STYLE property may be used to automatically draw the crosshair, while the LOCATION property may be used to manually draw the crosshair.
You can get and set the following properties on the retrieved crosshair:
|
Property |
Description |
|
ANTIALIAS |
Set to 1 to enable anti-aliasing for the lines.
|
|
COLOR |
A string or RGB vector containing the color.
|
|
HIDE |
Set to 1 to hide the crosshair, 0 to show.
|
|
INTERPOLATE |
Set to 1 to force interpolation between Plot data points when SNAP is active. For other graphics this property is ignored. The default is 0.
|
|
LINESTYLE |
An integer or string giving the line style. The default is 'dot'. See Linestyle Values for additional options.
|
|
LOCATION |
The location at which to draw the crosshair. For Plot graphics, if SNAP is enabled, then only the X coordinate needs to be supplied. Otherwise, LOCATION should be set to a two-element vector [X, Y] for two-dimensional graphics or [X, Y, Z] for three-dimensional graphics. If STYLE is currently "None", then setting the LOCATION will automatically set the STYLE to "Manual".
|
|
NAME |
The name of the graphic.
|
|
SNAP |
Set to 1 to snap the crosshair to the nearest Plot data point. For other graphics this property is ignored. The default is 1.
|
|
STYLE |
An integer or string giving the crosshair style. Possible values are:
0 - "None" - never draw the crosshair. This is the default for all graphics except 2D plots.
1 - "Manual" - draw the crosshair using the LOCATION property.
2 - "Auto" - automatically draw the crosshair. This is the default for 2D plots.
|
|
THICK |
The thickness of the lines. The default is 1.
|
|
TRANSPARENCY |
The percent transparency of the lines. The default is 50.
|
|
UVALUE |
An IDL variable of any data type.
|
For example, use the CROSSHAIR property to draw a crosshair on an image:
im = IMAGE(/TEST, TRANSPARENCY=50, AXIS_STYLE=2)
c = im.CROSSHAIR
c.COLOR = 'red'
c.THICK = 2
c.LOCATION = [300, 200]
See Creating Functions to Control Mouse Events for a more detailed crosshair example.
DATA_LOCATION
Set this property to specify the position of the vectors or wind barbs at each data location. Possible values are:
- 0 or "Tail" - Vectors are positioned so that the vector tail lies on each data location.
- 1 or "Center" - Vectors are positioned so that the vector center lies on each data location (the default).
- 2 or "Head" - Vectors are positioned so that the vector head lies on each data location.
DIRECTION_CONVENTION
Set this property to indicate the convention to be used when displaying vector directions. Possible values are:
- 0 or "Polar" - This describes the direction counterclockwise from X axis, and is the usual physics convention (the default).
- 1 or "Meteorological" - This describes the direction from which the wind is blowing, and uses terms such as northerly, westerly, and so on.
- 2 or "Wind" - This describes the wind azimuth (the direction towards which the wind is blowing), and uses terms such as southward, eastward, and so on.
Note: This property does not change the visual appearance of the vectors - only the direction that is reported in the window's status bar is affected.
FONT_COLOR
Set this property to a string or RGB vector that specifies the text color of the title and axes (if present). The default value is "black".
FONT_NAME
Set this property equal to a string specifying the IDL or system font for the title and axes (if present). The default value is "DejaVuSans".
FONT_SIZE
Set this property equal to an integer specifying the font size for the title and axes (if present). The default value is 9 points for the axis text and 11 points for the title.
FONT_STYLE
Set this property equal to an integer or a string specifying the font style for the title and axes (if present). Allowed values are:
|
Integer |
String |
Resulting Style |
|
0 |
"Normal" or "rm"
|
Default (roman) |
|
1 |
"Bold" or "bf" |
Bold |
|
2 |
"Italic" or "it"
|
Italic |
|
3 |
"Bold italic" or "bi"
|
Bold italic |
GRID_UNITS
Set this property to a string or integer specifying the units for the vector grid. This property applies only when a map projection is inserted. It has the following values:
-
0 or "" - None. The grid is in arbitrary units that are not tied to a map projection. The vectors will not be warped to the current map projection.
-
1 or "m" or "meters" - Meters. The grid is in meters, and is tied to a particular map projection. The vectors will be warped to the current map projection.
-
2 or "deg" or "degrees" - Degrees. The grid is in degrees longitude/latitude, and will be automatically warped to the current map projection.
HEAD_ANGLE
Set this property to a floating-point value between 0 and 90 giving the angle in degrees of the arrowhead to the shaft. The default is 30.
HEAD_INDENT
Set this property to a floating-point value between -1 and +1 giving the indentation of the back of the arrowhead along the shaft. A value of 0 gives a triangular shape, a value of +1 will create an arrowhead that is just two lines, while a value of -1 will create a diamond shape. The default is 0.4.
HEAD_PROPORTIONAL
Set this property to make the size of arrowheads proportional to their magnitude. The default is to make all arrowheads the same size. This property is ignored for wind barbs.
HEAD_SIZE
Set this property to a floating-point value giving a scale factor to be used when drawing the arrow heads or feathers. The default is 1.0.
HIDE
Set this property to 1 to hide the graphic. Set HIDE to 0 to show the graphic.
LENGTH_SCALE
Set this property to a floating-point value giving a scale factor for the length of arrows or barbs. The default is 1.0.
MAPGRID (Get Only)
If a map projection is currently in effect, this property retrieves a reference to the MAPGRID object.
MAPPROJECTION (Get Only)
If a map projection is currently in effect, this property retrieves a reference to the MAPPROJECTION object.
MAP_PROJECTION
A string giving the name of the current map projection. After creation, use this property to retrieve or set the current map projection.
MAX_VALUE
Set this property to the maximum magnitude value to be plotted. Vectors which have a magnitude greater than this value are treated as missing data. The default is to display all vectors.
MIN_VALUE
Set this property to the minimum magnitude value to be plotted. Vectors which have a magnitude smaller than this value are treated as missing data. The default is to display all vectors.
NAME
A string that specifies the name of the graphic. The name can be used to retrieve the graphic using the brackets array notation. If NAME is not set then a default name is chosen based on the graphic type.
POSITION
Set this property to a four-element vector that determines the position of the graphic within the window. The coordinates [X1, Y1, X2, Y2] define the lower left and upper right corners of the graphic. Coordinates are expressed in normalized units ranging from 0.0 to 1.0. On creation, if the DEVICE keyword is set, the units are given in device units (pixels).
Note: After creation, you can set the POSITION to either a two or four-element vector. If two elements are provided, the center of the graphic will be translated to that position. If four elements are provided, the graphics will be translated and scaled to fit the position.
RGB_TABLE
The number of the predefined IDL color table, or a 3 x 256 or 256 x 3 byte array containing color values to use for the color palette. This color palette is used when either the AUTO_COLOR property is set or if VECTOR_COLORS is set to an array of color indices. The default is to use a grayscale ramp.
SUBSAMPLE_METHOD
If either X_SUBSAMPLE or Y_SUBSAMPLE are set to a value greater than 1, then set this property to specify the method used for subsampling. Possible values are:
- 0 - Nearest neighbor (this is the default)
- 1 - Bilinear
Note: If U and V are one-dimensional arrays then this property is ignored and the nearest neighbor method is always used.
SYMBOL
A string giving the symbol name to be used for any missing vectors (see the MIN_VALUE and MAX_VALUE properties). Allowed values are:
|
"None" (the default)
"Plus" or "+"
"Asterisk" or "*"
"Period" or "dot"
"Diamond" or "D"
"Triangle" or "tu"
"Square" or "s"
"X"
"Greater_than" or ">"
|
"Less_than" or "<"
"Triangle_down" or "td"
"Triangle_left" or "tl"
"Triangle_right" or "tr"
"Tri_up" or "Tu"
"Tri_down" or "Td"
"Tri_left" or "Tl"
"Tri_right" or "Tr"
|
"Thin_diamond" or "d"
"Pentagon" or "p"
"Hexagon_1" or "h"
"Hexagon_2" or "H"
"Vline" or "|"
"Hline" or "_"
"Star" or "S"
"Circle" or "o"
|
Note that symbol names of more than 1 character are case insensitive, while single-character names are case sensitive.
SYM_COLOR
Set this property to a string or RGB vector that specifies the color for the missing-point symbols.
Note: This color is applied to the symbols only if the USE_DEFAULT_COLOR property is explicitly set equal to zero.
SYM_FILLED
Set this property to 1 to fill the symbols.
SYM_FILL_COLOR
Set this property to a string or RGB vector that specifies the color for the filled portion of the symbol. If this property is not set then the symbol fill color will match the SYM_COLOR.
SYM_OBJECT
Set this property equal to an object reference to be used for the missing symbols. The SYM_OBJECT may be either an IDLgrModel object or an atomic graphics object.
SYM_SIZE
A floating point value specifying the size of the vector symbol. A value of 1.0 produces a symbol that is 10% of the width/height of the vector.
SYM_THICK
A floating point value from 1.0 to 10.0 that specifies the thickness (in points) of the vector symbol.
SYM_TRANSPARENCY
An integer between 0 and 100 that specifies the percent transparency of the symbols. The default value is 0.
THICK
Set this property to a value between 0 and 10 that specifies the line thickness of the vectors or wind barbs. A thickness of 0 displays a thin hairline on the chosen device. The default value is 1.
TITLE
Set this property to a string specifying a title. The title properties may be modified using FONT_COLOR, FONT_NAME, FONT_SIZE, and FONT_STYLE. After creation the TITLE property may be used to retrieve a reference to the title text object, and the TEXT properties may be used to modify the title object.
You can add Greek letters and mathematical symbols using a TeX-like syntax, enclosed within a pair of "$" characters. See Adding Mathematical Symbols and Greek Letters to the Text String for details.
TRANSPARENCY
An integer between 0 and 100 that specifies the percent transparency of the graphic. The default value is 0.
USE_DEFAULT_COLOR
Set this property to use the color of the vectors for the missing-point symbols (this is the default). If this property is explicitly set to 0, the color specified by the SYM_COLOR property is used for symbols.
UVALUE
Set this property to an IDL variable of any data type.
VECTOR_COLORS
Set this property to a vector or two-dimensional array with the same number of elements as U, or a two-dimensional array containing RGB triplets (or RGBA) representing colors to be used for each vector. If this property is set to an array with the same number of elements as U, these values are indices into a color table that can be specified by the RGB_TABLE property. If the RGB_TABLE property is not set, a grayscale color is used. For RGB triplets the first dimension of VECTOR_COLORS must be 3 (or 4 for RGBA), and the second dimension must be equal to the number of elements in U. If this property is omitted, the vectors are drawn in the color specified by the COLOR property or the default color.
If VECTOR_COLORS is not of type byte, it is byte scaled into the range 0-255. This is useful if you have an auxiliary dataset (say of type float) and you want to color your vectors according to this auxiliary dataset.
Tip: IDL will remember the original data range of VECTOR_COLORS before byte scaling. If you insert a colorbar for the vector visualization, the colorbar axis will have the correct range for your auxiliary dataset.
VECTOR_STYLE
Set this property to specify the style of the vector visualization. Possible values are:
- 0 or "Arrows" - Vectors are drawn as arrows with lines for arrowheads.
- 1 or "Barbs" - Vectors are drawn as wind barbs with feathers and flags.
WINDOW (Get Only)
This property retrieves a reference to the WINDOW object which contains the graphic.
WINDOW_TITLE
Set this property to the title of the IDL Graphic window. The title is displayed in the window's title bar.
X_SUBSAMPLE
Set this property to an integer giving a subsampling factor to be used for the first dimension of U and V. If U and V are one-dimensional arrays then this property value is used for the subsampling factor for the arrays. This property is ignored if AUTO_SUBSAMPLE is true.
Y_SUBSAMPLE
Set this property to an integer giving a subsampling factor to be used for the second dimension of U and V. If U and V are one-dimensional arrays then this property is ignored and only the X_SUBSAMPLE is used. This property is ignored if AUTO_SUBSAMPLE is true.
XRANGE
A two-element vector giving the X data range to vector. The default behavior is to vector the entire data range.
YRANGE
A two-element vector giving the Y data range to vector. The default behavior is to vector the entire data range.
ZVALUE
A scalar value to be used as the z-coordinate for the entire vector. By default, 0.0 is used as the z-coordinate.
Version History
|
8.0 |
Introduced |
|
8.1 |
Added the following properties: CROSSHAIR, MAPPROJECTION, MAP_PROJECTION, MAPGRID, UVALUE, WINDOW, [XYZ]SHOWTEXT, [XYZ]STYLE
The THICK property was changed to accept a value between 0 and 10.
Added the following methods: Delete, GetData, GetValueAtLocation, MapForward, MapInverse, SetData
|
|
8.2 |
Added AXES, BACKGROUND_COLOR, BACKGROUND_TRANSPARENCY, CLIP properties.
|
|
8.2.1 |
Added ANTIALIAS property.
[XYZ]TICKUNITS accepts exponent as a value.
|
|
8.2.2 |
Change POSITION from a keyword to a property.
|
| 8.6 |
Changed default font name and font size. |
| 8.9 |
Allow subsampling to work if U and V are one-dimensional (an irregular grid). |
See Also
!COLOR, ARROW, COLORBAR, Formatting IDL Graphics Symbols and Lines, LEGEND,
STREAMLINE,
Using IDL graphics