You can evaluate the performance of one or more training sessions using TensorBoard or by viewing the metadata of the trained model. The TensorBoard option provides more detailed information and real-time accuracy metrics from training sessions.
You can also write a script to display TensorBoard during training or to start and stop a TensorBoard server using ENVITensorBoard.
TensorBoard
TensorBoard is a visualization toolkit that reports key metrics associated with training. TensorBoard displays in a web browser when training begins. Refer to the TensorBoard online documentation for details on how to use it.
To ensure that TensorBoard properly updates throughout the training process, change these settings:
- Click the
 icon in the TensorBoard toolbar. The Settings dialog appears.
- Enable the Reload Data option.
- Set the Reload Period to a minimum of 30 seconds.
- Dismiss the Settings dialog by clicking anywhere in the TensorBoard web page.
As training begins, TensorBoard displays real-time plots of various overall and per class metrics in the SCALARS dashboard. The following tabs are also available in the dashboard to understand how a model is performing during training:
-
IMAGES provides confusion matrices for both training and validation; this clarifies how the model may be confused.
-
DISTRIBUTIONS provides a visualization of how non-scalar data such as weights change over time.
-
HISTOGRAMS displays how some Tensors in the graph changed over time.
-
TIME SERIES provides visualizations of one model versus multiple models over time.

Separate display for training and validation. You can choose which options to display under the Runs section on the left side of the TensorBoard page. You can access the training metrics later by following these steps:
- In the ENVI Toolbox, select Deep Learning > Deep Learning Guide Map.
- From the Deep Learning Guide Map menu bar, select Training Metrics > Show Training Metrics. TensorBoard displays in a separate dialog.
The Show Training Metrics option in the Deep Learning Guide Map lets you manage and view previous training runs. By default, log files of previous training runs are saved to a tensorboard directory under your Auxiliary File Directory( described in the Preferences topic in ENVI Help). To change the directory in which to save log files, click the Logs Folder button in the TensorBoard dialog. Or, select Training Metrics > Set Logs Folder Location from the Deep Learning Guide Map menu bar.
Definitions of Metrics
Learning rate refers to the step size to take, or how much the weights are updated, during each epoch.
Loss is a unitless number that indicates how closely the classifier fits the validation training data. A value of 0 represents a perfect fit. The further the value from 0, the less accurate the fit. Separate Loss plots are provided for the batches completed within each epoch and for the completed epochs, both for training and validation datasets. Ideally, the Loss values reported in the training loss and validation loss plots should decrease rapidly during the first few epochs, then converge toward 0 as the number of epochs increases. The training loss plot corresponds to the "Loss" value displayed in the Training Model dialog as a model is being trained. The following example is a plot of validation loss during a training session:
Validation Loss: Red
Training Loss: Blue
Batch Loss: Orange
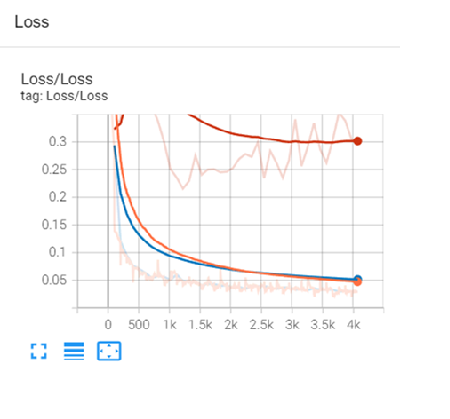
In this example, the Number of Epochs value was originally set to 25 in the Train Deep Learning Pixel Model dialog. However, you can see that the Loss value approached 0 around step #2k (shown in the x-axis of the plot). At that point, you could have chosen to stop the training by clicking the Cancel button in the Training Model progress dialog, since no further epochs were needed. The training run that produced this graph could have benefited with more data and a longer training run.
TensorBoard reports the validation loss values achieved for each epoch through the Number of Epochs you specify during training. With each epoch, the weights of the model are adjusted to make it more correct, and the label rasters are exposed to the model again. The weights from the epoch that produces the lowest validation loss will be used in the final, trained model. For example, if you want the model to complete 25 epochs and the lowest validation loss was achieved during Epoch #20, ENVI will retain and use the weights from that epoch in the trained model.
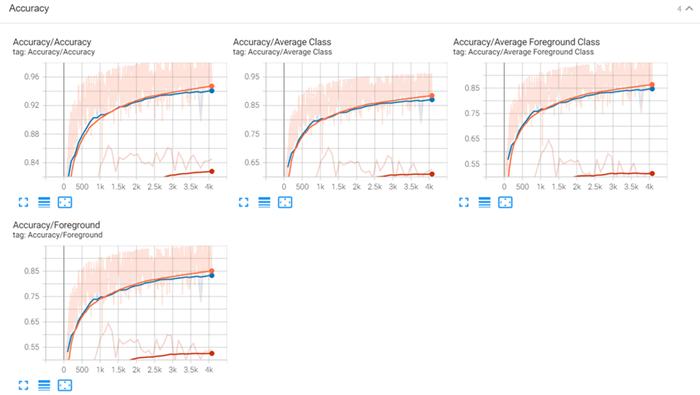
TensorBoard also reports the following accuracy metrics. You can find these plots under SCALARS in the TensorBoard dashboard:
-
Accuracy (also called classification accuracy or overall accuracy): Shows the ratio of predictions that the model got correct to the total number of predictions.
-
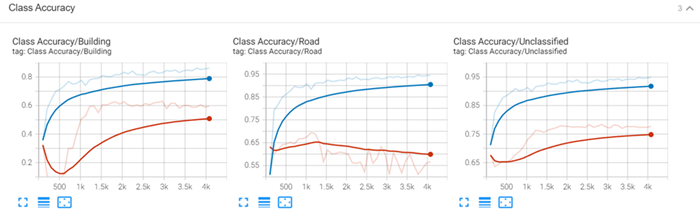
Class Accuracy: Shows a per-class accuracy of correct prediction for an individual class.
-
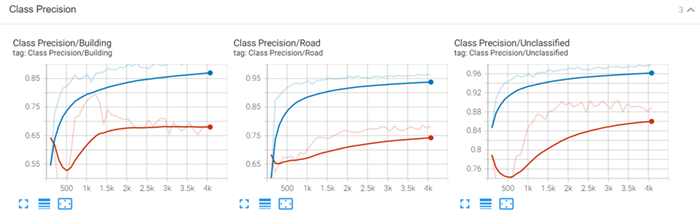
Class Precision: Shows a per-class probability that a value predicted for the given class is correct.
-
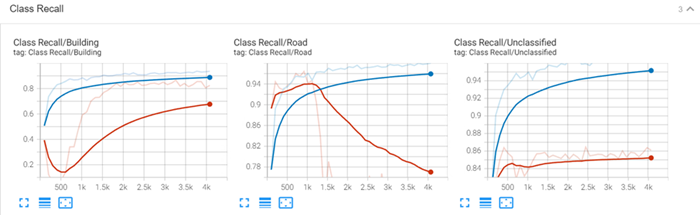
Class Recall: Shows the per class probability that a value in each class was classified correctly.
-
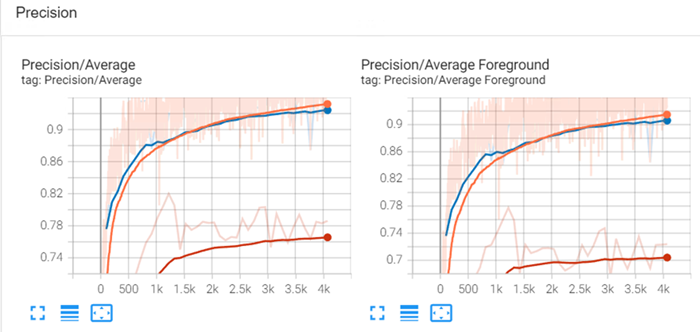
Precision (also called producer accuracy): Shows the probability that a value in each class was classified correctly.
-
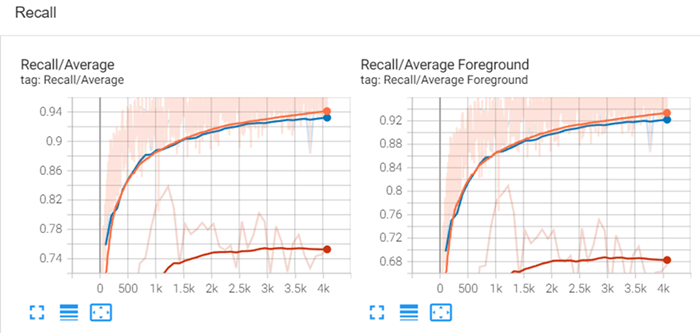
Recall (also called user accuracy): Shows the probability that a value predicted to be in a certain class really is that class. The probability is based on the fraction of correctly predicted values to the total number of values predicted to be in a class.
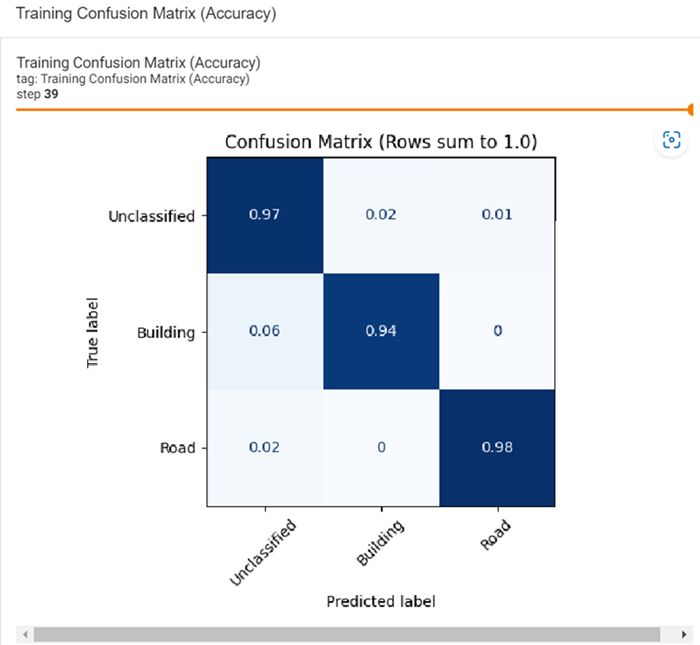
TensorBoard provides confusion matrices for the training dataset and the validation dataset. A confusion matrix is a visualization tool that provides the number of correct and incorrect predictions made by a classification model. The information in the matrices is used to calculate the scalar metrics listed above. This visualization is quick way to see how a model may be confusing class features. Below is an example of the training confusion matrix. You can find matrices under IMAGES in the TensorBoard dashboard:
TensorBoard also provides these training metrics:
- Time-based metrics for observing model weights over time under DISTRIBUTIONS.
- Tensor changes over time under HISTOGRAMS.
- One model versus multiple models over time under TIME SERIES.
Metadata
After a deep learning model has been trained, you can view metadata with accuracy metrics in the Deep Learning Guide Map using these steps:
- From the Deep Learning Guide Map menu bar, select Tools > Edit Deep Learning Model Metadata.
- Select a trained model file (.envi.onnx) and click Open. The Edit Deep Learning Model Metadata dialog appears.
- Optional: Edit the Name and Description attributes if desired.
- The remaining steps vary by model type. Refer to the sections that follow.
Mask-Based Model Attributes
- Scroll through the text in the Attributes section and find the lastSavedEpoch field. The value listed for epoch is the epoch number at which the lowest Loss value was achieved. For example, if you trained a model to complete 20 epochs (i.e., you specified a value of 20 for Number of Epochs during training) and the lowest Loss value was achieved during Epoch #17, ENVI only reports accuracy metrics for the first 17 epochs.
- Scroll to the metrics section to view the validationLoss, validationPrecision, validationRecall, and validationF1 values reported for each completed epoch. These are the same values that TensorBoard reports, except that TensorBoard reports the values for all epochs.
Object Detection Model Attributes
The Attributes section consists of three parts:
- Loss values reported for each epoch
- Validation loss values reported for each epoch
- Model metadata