BUBBLEPLOT on a Map
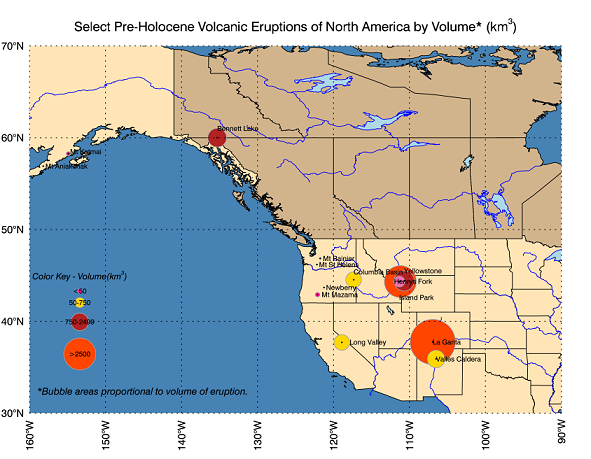
This example demonstrates how to create a BUBBLEPLOT that is integrated with an underlying map. The graphic above depicts several North American volcanoes with their largest eruptions (by volume) represented with the BUBBLEPLOT function. The area of each bubble is proportional to the size of the largest eruption.
First, create the underlying map using the MAP and MAPCONTINENTS functions. Next, set up the variables that contain the data for the volcanic eruptions, then create the BUBBLEPLOT and a separate key. Optionally plot the center points of the bubbles using the PLOT function.
Copy and paste the following code to the IDL command line to generate the above graphic.
Map = MAP('Geographic', CENTER_LONGITUDE=-122, $
DIMENSIONS=[900,700], LIMIT=[30,-160,70,-90], $
FILL_COLOR="steel blue", LINESTYLE='dotted', $
LABEL_POSITION=0, FONT_SIZE=12, $
MARGIN=[0.05,0.1,0.05,0.1], ASPECT_RATIO=0)
m1 = MAPCONTINENTS(/USA, COMBINE=0, FILL_COLOR="MOCCASIN")
m2 = MAPCONTINENTS(/CANADA, COMBINE=0, FILL_COLOR="tan")
m3 = MAPCONTINENTS(/LAKES, FILL_COLOR="light blue")
m4 = MAPCONTINENTS(/RIVERS, COLOR="blue")
long = [-158.2,-122.18,-122.1,-154.9,-106.94,-118.9,-111.33,-111.2, $
-121.25,-106.5,-110.7,-135.3,-121.75,-117.35]
lat = [56.9,46.18,42.9,58.26,37.75,37.7,44.33,44.33,43.68,35.9,44.4, $
60,46.85,44.53]
vol = [1,0.4,50,41,5000,600,280,2500,0.3,750,1000,850,8,600]
labels = [' Mt Aniakchak',' Mt St Helens',' Mt Mazama',' Mt Katmai', $
'La Garita','Long Valley','Henrys Fork','Island Park',' Newberry', $
'Valles Caldera','Yellowstone','Bennett Lake',' Mt Rainier','Columbia Basin']
positions = ['right','right','right','top','center','right','left','bottom', $
'right','center','top','top','right','top']
myColors = ['deep pink','deep pink','deep pink','deep pink','orange red', $
'gold','hot pink','orange red','deep pink', 'gold', 'firebrick', $
'firebrick','deep pink','gold']
myBP = BUBBLEPLOT(long, lat, MAGNITUDE=vol, EXPONENT=0.5, /OVERPLOT, $
LABELS=labels, LABEL_FONT_SIZE=8, LABEL_ALIGNMENT=0.0, $
LABEL_POSITION=positions, COLOR=myColors)
myPlot = SCATTERPLOT(long, lat, /OVERPLOT, SYMBOL='dot', $
SYM_SIZE=2, SYM_FILLED=1, SYM_FILL_COLOR='black')
myBP.Title = 'Select Pre-Holocene Volcanic Eruptions of North America ' + $
'by Volume* $(km^3)$'
myBP.Title.Font_size = 15
areaText = TEXT(-159, 32, TARGET=myBP, $
'*Bubble areas proportional to volume of eruption.', $
/DATA, COLOR='black', FONT_SIZE=11, FONT_STYLE='italic')
x = [1,1,1,1]
y = [.46,.71,.86,.95]
myLegendColors = ['orange red','firebrick','gold','deep pink']
bSizes = [2500,750,250,50]
bLabels = ['>2500','750-2499','50-750','<50']
myLegend = BUBBLEPLOT(x, y, MAGNITUDE=bSizes, COLOR=myLegendColors, $
EXPONENT=myBP.EXPONENT, XRANGE=[.8,1.2], YRANGE=[0,1], $
POSITION=[.1,.1,.17,.38], /CURRENT, AXIS_STYLE=0, LABELS=bLabels, $
LABEL_FONT_SIZE=8, TITLE='Color Key - Volume'+ '$(km^3)$', $
FONT_SIZE=10, FONT_STYLE='italic', MAX_VALUE=myBP.MAX_VALUE)
For additional examples using BUBBLEPLOT, see: Model the Study Area and Setting in the Environmental Monitoring Long Example.
See Also
!COLOR, BUBBLEPLOT, Formatting IDL Graphics Symbols and Lines, Graphics Window Interface, MAP, MAPCONTINENTS, PLOT, TEXT