IDL's Graphics window interface allows you to quickly and easily change the properties of graphics objects without typing anything at the command line. In this topic you will get a brief overview on how to use this Graphical User Interface (GUI).
The Graphics window looks and operates similarly in all of IDL's visualizations: plots, images, maps, contours, surfaces, and vectors. In this topic we explore the Graphics interface for Plot, noting any additions or exceptions for other visualization types.
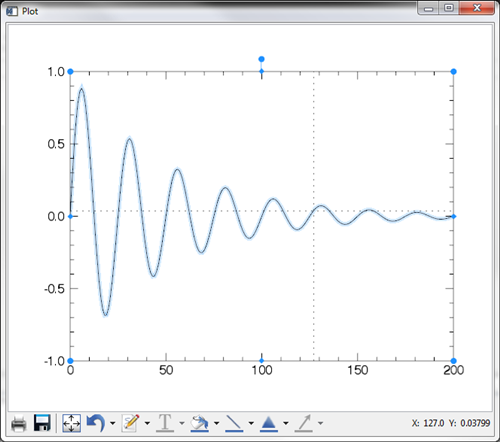
A basic plot window in Graphics might look something like this:
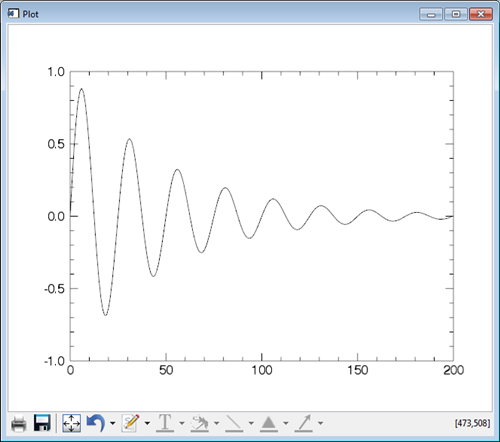
Generate this plot by copying and pasting the code below to the IDL command line:
data = SIN(2.0 * FINDGEN(200) * !PI / 25.0) * EXP(-0.02 * FINDGEN(200))
myPlot = PLOT(data)
You can use IDL commands to change the properties of this plot (see Changing Graphics Properties or Modifying Object Properties for further explanation), but you can also change many of those same properties directly inside the window itself.
General Tips
The Graphics window works similarly to other GUI-based drawing or graphics interfaces. Below are a few general tips to keep in mind:
- Make sure to select an object first with your mouse before attempting to change its properties with the options in the Graphics window.
- The type of object you select will determine which window options are available. For example, if you select a plot line, the Line Properties button will become available but the Fill Properties button will remain grayed out.
- If a button is grayed out either its use is not compatible with the selected object or an object has not been selected.
- The down-arrowhead indicator to the right of some of the buttons indicates that more options are available (see descriptions below). Click the arrowhead to display a dropdown menu containing further options.
- Graphics windows have two presentation layers: the data and the annotations. The data layer holds plots, images, maps, contours, surfaces, and vectors, as well as any associated axes, axis titles, plot titles, etc. The annotation layer consists of graphics objects you add to the graphic using the annotation tools in the Graphics window or in the graphics functions. Note that items in the annotation layer are always drawn on top of items in the data layer.
Graphics Window Buttons
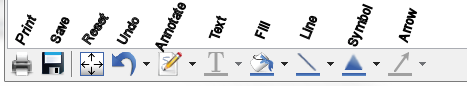
If you are using IDL from the Workbench, your Graphics window buttons should look like this:
If you use IDL from the command line, your Graphics window buttons should look like:
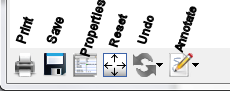
The functionality between the two windows is similar so this topic focuses on the Workbench Graphics window. We note where the functionality diverges and provide a brief explanation of the command line version of the window.
Print
The Print button allows you to output the contents of the Graphics window to a printer using your system's standard print interface. Using this button prints both the data and annotation layers (see General Tips, above).
Save
The Save button allows you to store the current graphic to your computer in one of several standard file formats. Save combines both layers of the current graphic to the output file format.
Reset Axis Range
If you have zoomed in or panned your graphic, clicking theReset Axis Range button will return the visualization to its original axis positions.
Undo
The options available inside the Undo dropdown include Undo, Redo, Bring to Front, Send to Back, and Copy Window. Undo/Redo work the same way as most other GUI-based programs. Copy Window copies the contents of the graphics window to your system's clipboard so that you can paste it into another program.
Bring to Front/Send to Back also work in a similar fashion as general drawing programs with one exception: they work only within an individual layer (see General Tips, above). What this means is that you can Bring to Front/Send to Back objects within a particular layer (for example, boxes and text within the annotation layer), but you cannot swap objects between layers (such as a plot line in the data layer with a filled box in the annotation layer). The annotation layer always remains on top of the data layer.
Annotate
Annotate options allow you to add the following types of objects to your visualization: Text, Line, Rectangle, Oval, Polygon, Freehand, Arrow, Legend, and Colorbar.
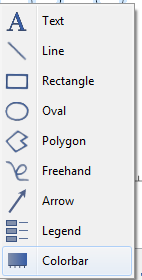
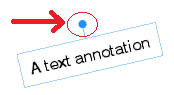
The Text, Line, Rectangle, Oval, Polygon, Freehand, and Arrow annotation options work similarly to other graphics and drawing programs. After you have added an annotation, you can modify the properties of the annotation by selecting it and using one or more of the Properties buttons described below.
To create a Legend or Colorbar, select your graphic first before choosing one of these options.
Note: The Legend option works with 2D or 3D line plots, bar plots, contour plots, or vector plots. Colorbar works with images and contour plots. If you need more control over Legends and Colorbars than this GUI allows, use the LEGEND and COLORBAR functions.
Text Properties
The Text Properties options allow you to change the appearance of text that you have selected in the Graphics window. Text properties work with text that appears in both the data (such as axis titles) and annotation layers (such as a note added with Annotate). Use Text Properties to change the selected text's color, font, appearance (bold/italic/normal), size, and transparency.
Note: The Text Properties button is available in the Workbench version of the Graphics window only.
Fill Properties
After you use Annotate to draw an enclosed object (such as a polygon, oval, or rectangle), you can use Fill Properties to define its interior color and transparency. You can also apply fill properties to data layer objects such as the bars in a BARPLOT or the boxes in BOXPLOT.
Note: The Fill Properties button is available in the Workbench version of the Graphics window only.
Line Properties
The Line Properties option can be used to change the appearance of any type of line in your visualization, in both the data and annotation layers. Use this option to change a line's color, weight, transparency, and whether it is dashed or solid.
You can apply this option to objects such as axes, plot lines, lines, rectangles, ovals, polygons, freehand lines, and arrows.
Note: The Line Properties button is available in the Workbench version of the Graphics window only.
Symbol Properties
Symbol Properties allow you to change the color, symbol type, size, and transparency of any symbol that you highlight in your visualization. You can add Symbols to your visualization separately using the SYMBOL function, or a symbol may be a part of the graphic you create (such as a location on a line plot that indicates a data point - see PLOT for an example)
Note: The Symbol Properties button is available in the Workbench version of the Graphics window only.
Arrow Properties
You can use Arrow Properties to change the style, thickness, and the arrowhead angle/indent/size of arrows that you draw using Annotate. To change other properties of the arrow, such as color, use the Line Properties and Fill Properties options (an arrow is considered a line object combined with a polygon).
Note: The Arrow Properties button is available in the Workbench version of the Graphics window only.
Property Sheet (Command Line version only)
The command line version of the Graphics Window combines Text, Fill, Line, Symbol, and Arrow Properties into a single Properties button. Select an object in the graphics window, then click the Properties button. A popup window appears that allows you to set or change properties for the selected object.
How-to
Obtain Coordinates and Crosshairs
Position your mouse pointer anywhere on the visualization to get the coordinates of that point - they show up in the lower right portion of the Graphics Window in graphic coordinates.
Position your mouse pointer over your graphic, hold down left mouse button, and drag the mouse to obtain crosshairs that snap to data points and give you the exact data point values. Note that this works only for plot graphics (excluding 3D plots).
Pan
If you have a scroll wheel or middle mouse button, press and hold it down to engage Pan mode then move your mouse to pan the graphic.
Zoom
Click on your graphic to select it, position your mouse pointer over the area of the graphic you want to zoom in/out on, then use the scroll wheel on the mouse to zoom in or out on that area.
Alternatively, press and hold down the <SHIFT> button on your keyboard while pressing your left mouse button. Your mouse pointer will change into an icon of a magnifying glass. Drag your mouse to define a zoom area, then release the <SHIFT> key and mouse button for the zoom operation to complete.
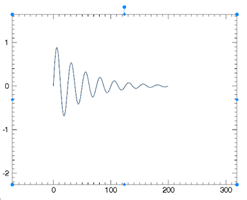
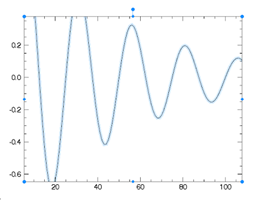
Below are examples of zooming out (left) and zooming in (right) on a plot:
Zoom in a Single Axis Dimension
Normally, when you use the scroll wheel to zoom in or out, then the zoom happens equally in both the X and Y dimensions. To zoom in or out in only one dimension, first select the axis dimension around which you want to zoom by clicking on either the X or Y axis. Once you have only one axis selected, then when you use the scroll wheel to zoom in or out, the zoom will only happen in the selected dimension. Note that the zoom will be centered about the mouse pointer's position along that axis.
Resize
Click in your graphic to select it, position your mouse pointer over one of the blue handles at the edges of the graphic, then use your left mouse button to drag the graphic to a new size.
Reposition
Move your mouse pointer over the edge of your graphic, not over a blue selection handle, until it is replaced by the Move icon:

Now press your left mouse button and drag your mouse to a new location to reposition the graphic.
Rotate
Move your mouse pointer over the large blue handle at the top of the graphic or object that you want to rotate.
Your mouse pointer will change into the Rotate icon:

Click on the Rotate handle and drag your mouse left or right to rotate the graphic. Release your left mouse button for the new position to take effect.
Delete an Object
Click on an object to select it then press the "Delete" button on your keyboard to delete it.
See Also
Modifying Object Properties, Changing Graphics Properties,