The IDL Code Coverage feature helps you analyze the lines of code that were executed within your application. Use code coverage to identify unused or unneeded code paths, or to ensure that your "unit tests" are exercising all of your code.
There are three ways to use the Code Coverage feature:
- CODE_COVERAGE function
- IDL Workbench Editor view
- IDL Workbench Profiler view
CODE_COVERAGE Function
With this method, you can compile and run your application, then call CODE_COVERAGE for each routine. This will return the lines of code that were not executed and, optionally, the lines that were executed.
For example, save the following code in a file. Compile the code, but do not run it:
function ex_codecover
PRINT, 2+2
if (0) then begin
PRINT, "never reached"
endif else begin
PRINT, "reached"
endelse
return, 1 & PRINT,'never reached'
PRINT, 'past the return'
end
Call the CODE_COVERAGE routine and print the results:
r = CODE_COVERAGE('ex_codecover', EXECUTED=e)
PRINT, 'Lines not executed: ', r.ToString()
PRINT, 'Lines executed: ', e.ToString()
IDL prints:
Lines not executed: 1 2 4 5 7 9 9 10
Lines executed: 0
Note that line 9 is repeated twice since there are two statements on the same line.
Now call the function and then call CODE_COVERAGE:
void = EX_CODECOVER()
r = CODE_COVERAGE('ex_codecover', EXECUTED=e)
print, 'Lines not executed: ', r.ToString()
print, 'Lines executed: ', e.ToString()
IDL prints:
Lines not executed: 5 9 10
Lines executed: 1 2 4 7 9
Note that line 9 is now in both the "executed" and "not executed" list, since only one of the statements was executed.
See CODE_COVERAGE for the rules on what is considered a "line of code."
Code Coverage in the Editor View
To enable code coverage in the Editor view, select Run > Show Code Coverage from the Workbench main menu.
The code coverage annotations will appear in any Editor view that contains compiled code. If you open an Editor that does not contain compiled code, those lines will not be highlighted.
For example, the routine shown above is open in the Editor view. Press the Compile button to compile the code but not run it. The Editor should show the following:
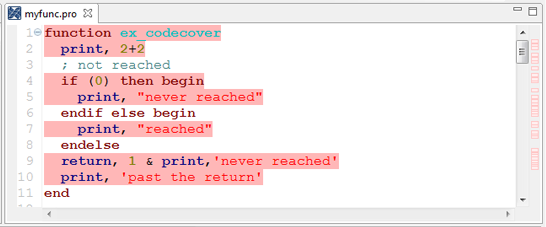
The lines of code are highlighted in red, indicating that they have not been executed.
Now run the code by typing the following command:
IDL> void = EX_CODECOVER()
The Editor will update the highlighting to show which lines have been executed:
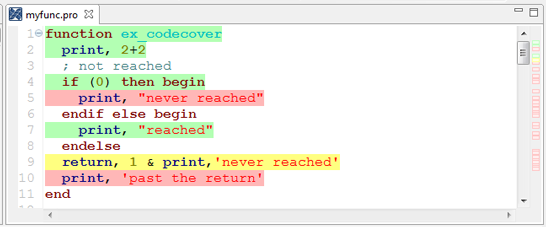
In the example above, the green lines have been executed at least once and the red lines have not been executed. In line 9, the first statement was executed but the second statement was not; in this case, partially executes lines are colored yellow.
The right side of the Editor view shows a snapshot of the full file, with small green, yellow, or red bars. Hover the mouse over one of the small bars to display the corresponding line of code, or click on a small bar to jump to that section of code.
If you have other Editors open, then switching to another editor will immediately show the code coverage for that file.
To reset the code coverage for a file, you can either re-compile the file or use the CODE_COVERAGE function with the /CLEAR keyword. Resetting the IDL session will also clear out the code coverage.
To turn off the code coverage highlighting, select Run > Hide Code Coverage from the Workbench main menu.
Tip: IDL automatically keeps track of code coverage for all compiled routines, regardless of the setting of the Code Coverage menu item. You could run your entire application, turn on "Show Code Coverage", and then open up your code in the Editor. The Editor will then update with the current code coverage highlighting.
Code Coverage in the Profiler View
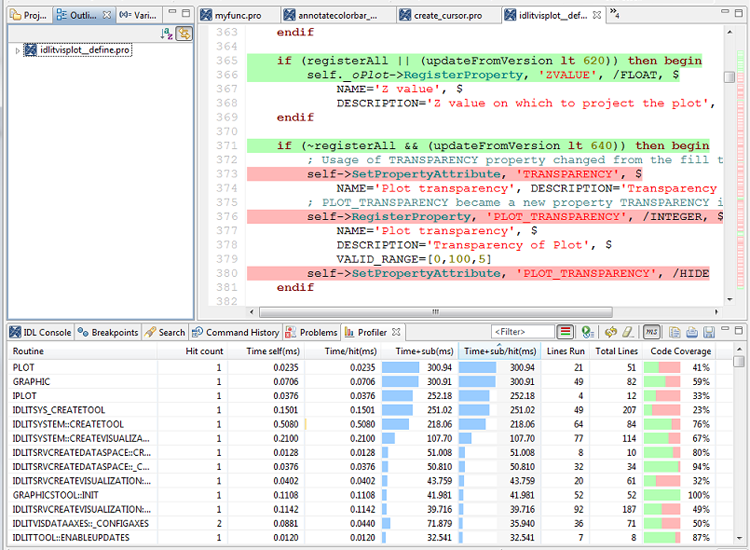
The Profiler view has three columns related to code coverage:
- Lines Run is the number of code lines that were executed within the routine. This will be empty for system routines.
- Total Lines is the total number of code lines within the routine. This will be empty for system routines.
- Code Coverage is the fraction of the total lines of code that were executed, which is the ratio of Lines Run to Total Lines. A value of 0% indicates that none of the code was executed, while 100% indicates that all of the code was executed.
The Code Coverage column also contains a graph for each routine, showing green for the percentage of code that was executed, and red for the percentage of code that was not executed. Click on the Code Coverage column heading to sort the view in either increasing or decreasing percentage.
If you double-click on an IDL .pro routine, the Editor will open to that routine. If code coverage is not already displayed, enable the Show Code Coverage button on the Profiler view toolbar, or select Run > Show Code Coverage from the IDL Workbench main menu.
See Profiler View for more details on using the Profiler.
Changing the Highlighting Colors
You can change the appearance of the green, yellow, and red highlighting bars in the IDL Workbench Preferences. In the Preference dialog, select General > Editors > Text Editors > Annotations. You can set highlight colors for three different annotation types in the Annotations dialog that appears.
- Code Coverage Executed (default is green)
- Code Coverage Not Executed (default is red)
- Code Coverage Partially Executed (default is yellow)
Changing the colors will change the highlighting in both the Editor view and in the Profiler view.