You can format IDL Graphics colors, lines, and symbols using either properties or the string argument Format.
Examples
As an example, to set the plotting symbol to a plus character, the plotting color to green, the linestyle to a dash-dot-dot-dot line, and the line thickness to a value of 2, you could use the Format string argument:
myPlot = PLOT(/TEST, '+g-:2')
Note: When using a Format string, you can include any combination of modifiers, in any order. IDL is case-sensitive when interpreting the Format argument and associated keyword strings.
Alternatively, you could set the properties individually:
myPlot2 = PLOT(/TEST, SYMBOL='+', COLOR='Green', LINESTYLE='-:', THICK=2)
Color Values
The following table lists the single characters that you can use as the color modifier in either the COLOR property or the Format string argument.
Note: When using the COLOR property, you may specify either the color name or its character inside of single quotes in your call. Using the COLOR property is case insensitive. However, if you use the Format string argument, you must use the lower-case character color designation.
|
Color Name |
Character |
|
Blue |
b |
|
Green |
g |
|
Red |
r |
|
Cyan |
c |
|
Magenta |
m |
|
Yellow |
y |
|
Black |
k |
|
White |
w |
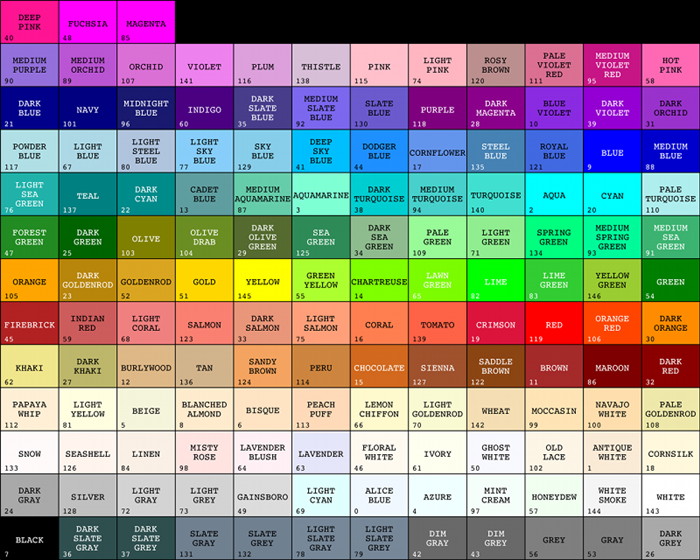
When setting the COLOR property, you can also use any of the string values (color names) defined by the !COLOR system variable, as shown in the following image:
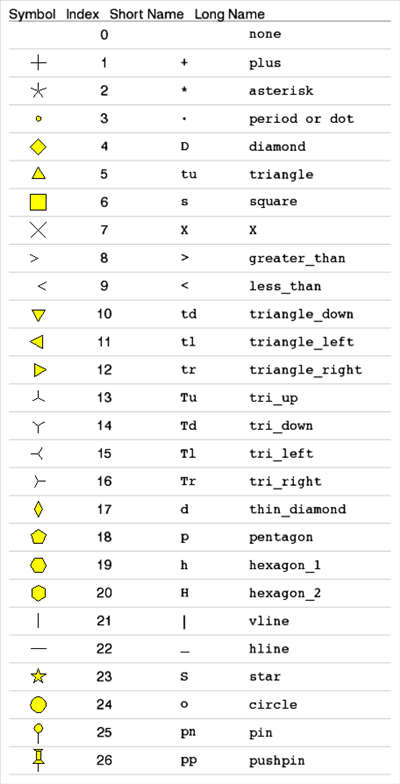
Plot Symbol Values
The following table lists the IDL plot symbol values. For the SYMBOL property, you may use an index value, the short name, or the long name. For the Format string argument you may use only the short name.
Note: If you use a Format string that contains a symbol but no linestyle (for example, 'd'), the linestyle value is set to 6 (no line is drawn).
Linestyle Values
The following table lists the index values, strings, and characters you can use with the LINESTYLE property, and the equivalent characters and strings you can use in the Format string argument.
|
Index |
LINESTYLE Property
|
Format Argument |
Description |
|
0 |
'solid_line', '-'(dash)
|
'-' (dash) |
solid line |
|
1 |
'dot', ':'(colon)
|
':'(colon) |
dotted |
|
2 |
'dash', '--' (double dashes)
|
'--' (double dashes)
|
dashed |
|
3 |
'dash_dot', '-.'
|
'-.' |
dash dot |
|
4 |
'dash_dot_dot_dot', '-:'
|
'-:' |
dash dot dot dot
|
|
5 |
'long_dash', '__' (two underscores)
|
'__' (double underscores)
|
long dash |
|
6 |
'none', ' ' (space)
|
' ' (space) |
no line |
Note: If you use the LINESTYLE value or Format string '-.', the linestyle is set to dash-dot and the plot symbol is not set.
Note: You can also set LINESTYLE to a two-element vector, [repeat, bitmask], specifying a stippling pattern. The repeat indicates the number of times that individual bits in the bitmask should be repeated. (That is, if three consecutive 0’s appear in the bitmask and the value of repeat is 2, then the line that is drawn will have six consecutive bits turned off.) The value of repeat must be an integer between 1 and 255. The bitmask indicates which pixels are drawn and which are not along the length of the line. The bitmask should be specified as a 16-bit hexadecimal value. For example, LINESTYLE = [2, 'F0F0'X] describes a dashed line (8 bits on, 8 bits off, 8 bits on, 8 bits off).
Line Thickness Values
You can specify a line thickness value (from 0 to 10) using the THICK property, or by including a value in the Format string. The default line thickness is 1 point.