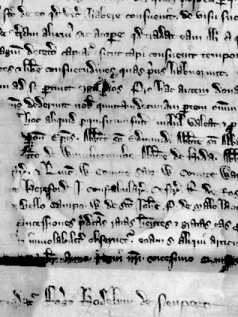
Image thresholding is a simple form of image segmentation. It is a way to create a binary image from a grayscale or full-color image. This is typically done in order to separate "object" or foreground pixels from background pixels to aid in image processing.
In this example, you will use IMAGE_THRESHOLD to automatically calculate separate threshold values for one image using different algorithms. You will then use each threshold to create separate images which allows you to compare the outputs of the different algorithms.
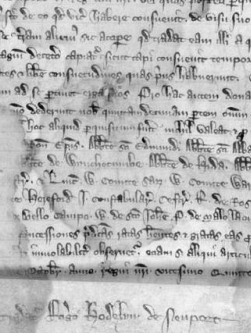
data = READ_IMAGE(FILEPATH('MagnaCarta1.png', $
SUBDIRECTORY=['examples', 'data']))
view_orig = IMAGE(data)
IDL Displays the image (on the left, below):
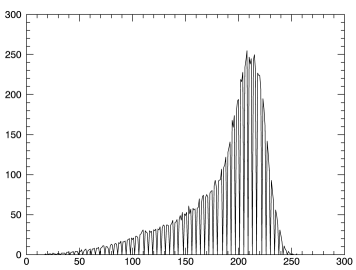
hist = BYTSCL(HISTOGRAM(data))
hist_plot = PLOT(hist)
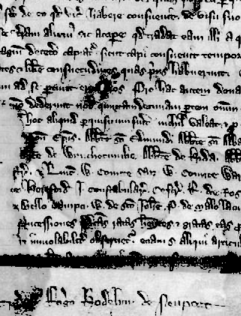
First apply the default algorithm, ISODATA:
iso_result = IMAGE_THRESHOLD(data, THRESHOLD=t, /BYIMAGE)
PRINT, t
IDL displays:
165
data[WHERE(iso_result EQ 0)] = 0
iso_view = IMAGE(data)
The image after applying the ISODATA algorithm:

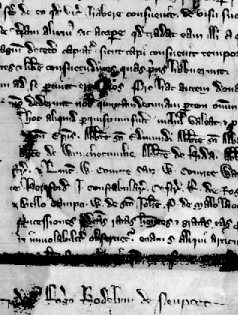
Now use the second algorithm, OTSU:
data2 = READ_IMAGE(FILEPATH('MagnaCarta1.png', $
SUBDIRECTORY=['examples', 'data']))
otsu_result = IMAGE_THRESHOLD(data2, THRESHOLD=o, /BYIMAGE, /OTSU)
PRINT, o
IDL displays:
163
data2[WHERE(otsu_result EQ 0)] = 0
otsu_view = IMAGE(data2)
The image after applying the OTSU algorithm:
Apply the third algorithm, MOMENTS:
data3 = READ_IMAGE(FILEPATH('MagnaCarta1.png', $
SUBDIRECTORY=['examples', 'data']))
moments_result = IMAGE_THRESHOLD(data3, THRESHOLD=m, /BYIMAGE, /MOMENTS)
PRINT, m
IDL displays:
162
data3[WHERE(moments_result EQ 0)] = 0
moments_view = IMAGE(data3)
The image after applying the MOMENTS algorithm:
Apply the fourth algorithm, MAXENTROPY:
data4 = READ_IMAGE(FILEPATH('MagnaCarta1.png', $
SUBDIRECTORY=['examples', 'data']))
entr_result = IMAGE_THRESHOLD(data4, THRESHOLD=e, /BYIMAGE, /MAXENTROPY)
PRINT, e
IDL displays:
137
data4[WHERE(entr_result EQ 0)] = 0
entr_view = IMAGE(data4)
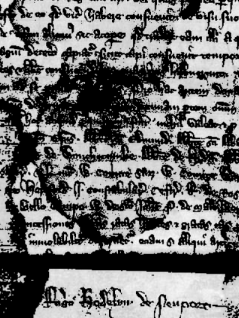
The image after applying MAXENTROPY:
Note: In this image, above, we start to see some definition in the lettering in the shadowed area across the bottom quarter of the image.
Apply the next algorithm, MINERROR:
data5 = READ_IMAGE(FILEPATH('MagnaCarta1.png', $
SUBDIRECTORY=['examples', 'data']))
minerr_result = IMAGE_THRESHOLD(data5, THRESHOLD=r, /BYIMAGE, /MINERROR)
PRINT, r
IDL displays:
197
data5[WHERE(minerr_result EQ 0)] = 0
minerr_view = IMAGE(data5)
The image after applying MINERROR:
Apply the final algorithm, MEAN:
data6 = READ_IMAGE(FILEPATH('MagnaCarta1.png', $
SUBDIRECTORY=['examples', 'data']))
mean_result = IMAGE_THRESHOLD(data6, THRESHOLD=a, /BYIMAGE, /MEAN)
PRINT, a
IDL displays:
186
data6[WHERE(mean_result EQ 0)] = 0
mean_view = IMAGE(data6)
The image after applying the MEAN algorithm:
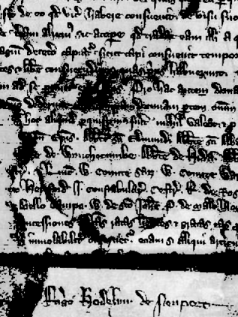
As you can see from the above examples, each algorithm does not work equally well on this particular image. You may need to try each algorithm independently to judge whether it is beneficial to use in your situation.