IDL provides several ways to display multiple graphics in one window. The following keywords are common to all the IDL graphics:
- LAYOUT: this keyword allows you to define a grid and then place multiple graphics within cells in the grid using the CURRENT keyword
- POSITION: this keyword allows you to specify exactly where in the window to place graphics using the CURRENT keyword
- OVERPLOT: this keyword allows you to place one graphic over another
- _EXTRA: this keyword lets you inherit properties from one graphic to use for other graphics
LAYOUT
The LAYOUT property specifies a grid within a graphics window, and determines where the graphic should appear. The syntax of LAYOUT is three numbers: [ncolumns, nrows, location]. The grid is determined by the number of columns (ncolumns) by the number of rows (nrows). The location of the graphic is determined by the third number. The grid numbering starts in the upper left (1) and goes sequentially by column and then by row.
Note: For each graphic after the first one, you must use the CURRENT property to direct IDL to place the graphic in the same window.
The following example shows precipitation and temperature data for Denver, Colorado.
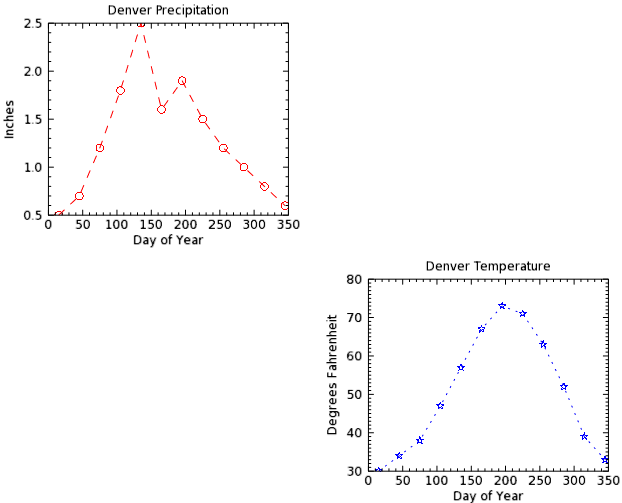
The code shown below creates the graphic shown above. You can copy the entire block and paste it into the IDL command line to run it.
PRECIP = [0.5,0.7,1.2,1.8,2.5,1.6,1.9,1.5,1.2,1.0,0.8,0.6]
TEMP = [30, 34, 38, 47, 57, 67, 73, 71, 63, 52, 39, 33]
DAY = FINDGEN(12) * 30 + 15
myPlot = PLOT(DAY, PRECIP, 'ro--',$
TITLE='Denver Precipitation', $
YTITLE='Inches', XTITLE='Day of Year', $
LAYOUT=[2,2,1])
myPlotToo = PLOT(DAY, TEMP, 'bS:', $
TITLE='Denver Temperature', $
XTITLE='Day of Year', $
YTITLE='Degrees Fahrenheit', /CURRENT, $
LAYOUT=[2,2,4])
Both plots appear in the same window, as defined by LAYOUT.
LAYOUT Example Using the CONTOUR Function With OVERPLOT
The following example shows how to use LAYOUT as a simple grid.
The code shown below creates the graphic shown above. You can copy the entire block and paste it into the IDL command line to run it.
RESTORE, FILEPATH('marbells.dat', SUBDIR=['examples','data'])
myImage = IMAGE(elev, LAYOUT=[2,1,1],$
MARGIN=[0.05, 0.22, 0.05, 0.22], $
TITLE='Maroon Bells Image')
myImageToo = IMAGE(elev, /CURRENT, LAYOUT=[2,1,2],$
MARGIN=[0.05, 0.22, 0.05, 0.22], $
TITLE='Maroon Bells Image with Contours')
myContour = CONTOUR(elev, N_LEVELS=10, /OVERPLOT)
POSITION
The POSITION property (common to all the graphics functions) allows you to position one or more graphics within one graphic window. Set this property to either a two-element or four-element vector. For two elements, the POSITION gives the location of the lower-left corner of the graphic, in normalized coordinates [x0, y0]. For four elements, the POSITION gives the lower left and upper right corners of the graphic, in the form [x0, y0, x1, y1].
Note: For each graphic after the first one, you must use the CURRENT property to tell IDL to place the graphic in the same window.
POSITION Example Using the OVERPLOT Keyword
The following example displays how to use POSITION in a freeform layout.
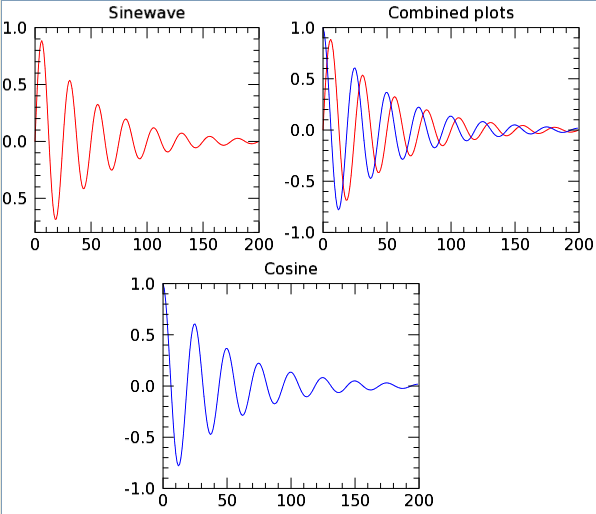
The code shown below creates the graphic shown above. You can copy the entire block and paste it into the IDL command line to run it.
sinewave = SIN(2.0*FINDGEN(200)*!PI/25.0)*EXP(-0.02*FINDGEN(200))
cosine = COS(2.0*FINDGEN(200)*!PI/25.0)*EXP(-0.02*FINDGEN(200))
myPlot = PLOT(sinewave, '-r',$
POSITION=[.05,.55,.40,.95], TITLE='Sinewave')
myPlotToo = PLOT(cosine, '-b',$
/CURRENT, POSITION=[.25,.05,.65,.45],$
TITLE='Cosine')
myThirdPlot = PLOT(sinewave, '-r',$
/CURRENT, POSITION=[.50,.55,.90,.95])
aPlot = PLOT(cosine, '-b', /OVERPLOT, TITLE='Combined plots')
POSITION Example Showing a Plot with a Subplot
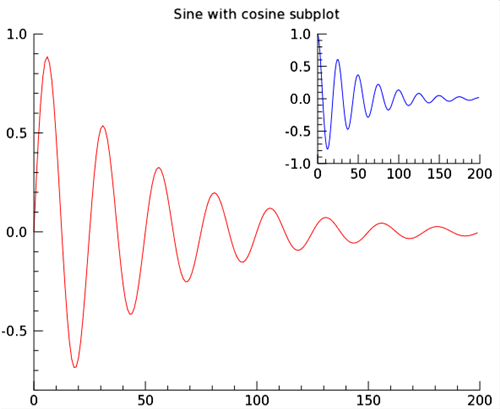
Using the same data as the example above, the following example shows how to position a large plot with a subplot:
sinewave = SIN(2.0*FINDGEN(200)*!PI/25.0)*EXP(-0.02*FINDGEN(200))
cosine = COS(2.0*FINDGEN(200)*!PI/25.0)*EXP(-0.02*FINDGEN(200))
myPlot = PLOT(sinewave, '-r', AXIS_STYLE=1, $
POSITION=[.075,.075,.90,.90], $
TITLE='Sine with cosine subplot')
myPlotTwo = PLOT(cosine, '-b', AXIS_STYLE=1, $
/CURRENT, POSITION=[.60,.60,.90,.90])
_EXTRA
Use the _EXTRA keyword to inherit keywords from one plot command to store and set properties for other plots.
Keyword Inheritance Example using the _EXTRA Keyword
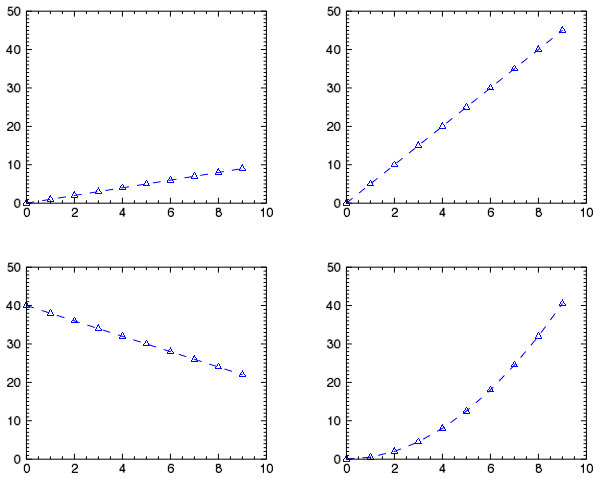
The following example shows how to define the properties for the first plot, then how to use the _EXTRA keyword to apply the same properties to the remaining plots. The example places all plots in the same graphics window.
y1 = FINDGEN(10)
y2 = y1 * 5
y3 = -2 * y1 + 40
y4 = 0.5 * y1^2
props = {current:1, color:'blue', $
linestyle:'dashed', symbol:'triangle', $
yrange:[0,50]}
myWindow = WINDOW( $
WINDOW_TITLE='Four plots with common properties')
myPlotOne = PLOT(y1, LAYOUT=[2,2,1], _EXTRA=props)
myPlotToo = PLOT(y2, LAYOUT=[2,2,2], _EXTRA=props)
myPlotThree = PLOT(y3, LAYOUT=[2,2,3], _EXTRA=props)
myPlotFour = PLOT(y4, LAYOUT=[2,2,4], _EXTRA=props)
Resources