Use the TEXT function to add labels and annotations to an existing graphic. You can use TEXT at the time you create the graphic or from the command line after the graphic is displayed.
The examples show a couple of ways you can use TEXT.
Plot with Math and Greek Symbols
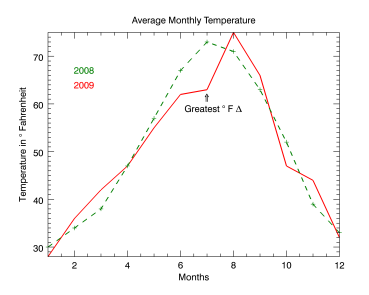
The code shown below creates the plot graphic shown above. You can copy the entire block and paste it into the IDL command line to run it.
temp08 = [30,34,38,47,57,67,73,71,63,52,39,33]
temp09 = [28,36,42,47,55,62,63,75,66,47,44,32]
months = [1,2,3,4,5,6,7,8,9,10,11,12]
p = PLOT(months, temp09, 'r', $
YTITLE='Temperature in $\circ$ Fahrenheit', $
XTITLE='Months', $
TITLE='Average Monthly Temperature', $
THICK=2)
p2 = PLOT(months, temp08, '--+2g', /OVERPLOT)
text08 = TEXT(0.2,0.75,'2008', /CURRENT, COLOR=!color.green)
text09 = TEXT(0.2,0.70,'2009', /CURRENT, COLOR=!color.red)
arrow = TEXT(0.58, 0.64, '$\Uparrow$', /CURRENT)
difftext = TEXT(0.5, 0.62, $
'Greatest $\circ$ F $\Delta$', /CURRENT)
See Adding Mathematical Symbols and Greek Letters to the Text String for details on the available symbols.
Map with Labels
This example displays a map of part of the US using the MAP, MAPCONTINENTS, and TEXT functions.
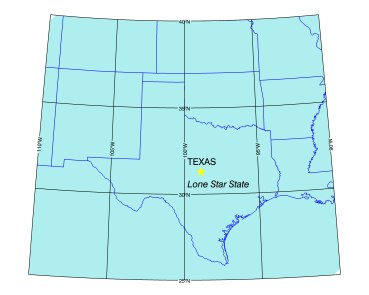
The code shown below creates the graphic shown above. You can copy the entire block and paste it into the IDL command line to run it.
map = MAP('STEREOGRAPHIC', $
FILL_COLOR="Pale turquoise", $
LIMIT = [25.0,-110,40.0 -90.0], $
CENTER_LATITUDE=25.0, $
CENTER_LONGITUDE=-100.0)
states = MAPCONTINENTS(/US, COLOR="blue")
texas = TEXT(-99.8, 31.7, /DATA, 'TEXAS')
star = TEXT(-99.2, 30.4, /DATA, '*', $
FONT_SIZE=28, FONT_STYLE='Bold', $
FONT_COLOR='yellow')
label = TEXT(-99.8, 30.4, /DATA, $
'Lone Star State', FONT_STYLE='Italic')
Add a Character Symbol to a Map
This example demonstrates adding a character-based symbol to a map using the MAP and SYMBOL functions.
myMap = MAP('orthographic', $
LIMIT=[35.86,-110.51,42.58,-100.01], $
CENTER_LONGITUDE=-105, CENTER_LATITUDE=40)
c = MAPCONTINENTS(/USA)
myMap.MAPGRID.HIDE = 1
s1 = SYMBOL(-104.48, 39.58, SYM_TEXT='$\alpha$', $
SYM_COLOR='Green', LABEL_STRING='Primary Site', $
/DATA, LABEL_POSITION='Top', $
SYM_FONT_SIZE=20)
s2 = SYMBOL(-106.21, 39.38, SYM_TEXT='$\beta$', $
SYM_COLOR='Green', LABEL_STRING='Backup Site', $
/DATA, LABEL_POSITION='Bottom', $
SYM_FONT_SIZE=20)
See Adding Mathematical Symbols and Greek Letters to the Text String for details on the available symbols.
Resources