Use the POLYGON function to draw a square, rectangle, or other multi-sided shape on an existing graphic. You can use POLYGON at the time you create the graphic, or from the command line after the graphic is displayed.
The example shows an image of Mars with a shape that defines a study area.
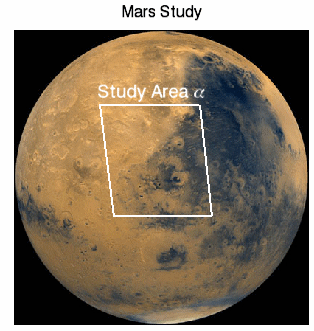
The code shown below creates the graphic shown above. You can copy the entire block and paste it into the IDL command line to run it.
file = FILEPATH('marsglobe.jpg', $
SUBDIRECTORY = ['examples', 'data'])
mglobe = IMAGE(file, TITLE='Mars Study')
coords = [[116, 298],[251, 298], $
[268, 147], [135, 147]]
alpha = POLYGON(coords, TARGET=mglobe, /DATA, $
FILL_BACKGROUND=0, COLOR='white', THICK=2)
alphatext = TEXT(113, 307, TARGET=mglobe, $
'Study Area $\alpha$', $
COLOR='white', /DATA, FONT_SIZE=18)
Resources